In this post, I am going to explain the how to control the number of column per in the matrix dynamically. Even though this is not my own finding, this concept may be very useful for many of us. This blog is written based the many post that already available in the internet.
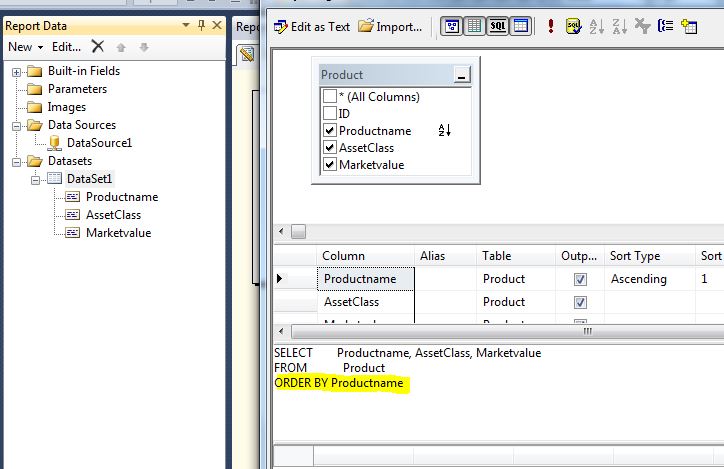
Data set that I used here is:
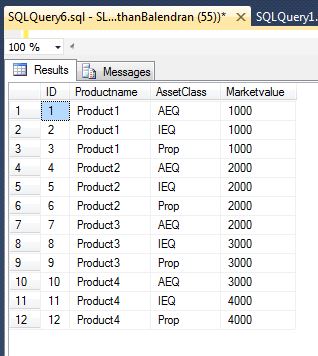
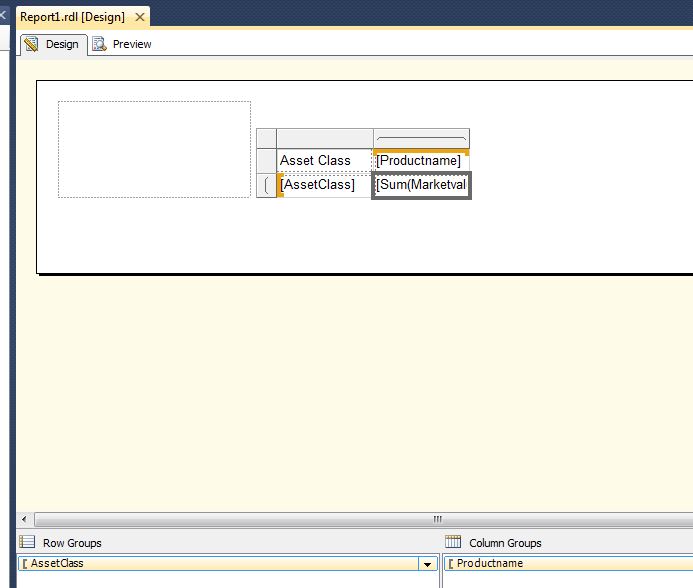
If matrix report, if we design as below, display will be as following:

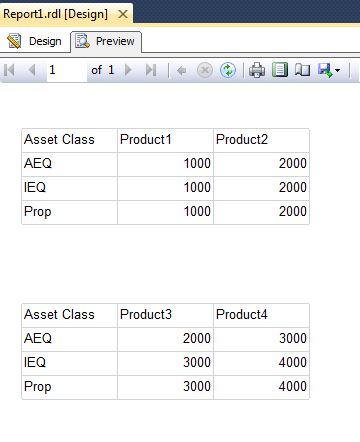
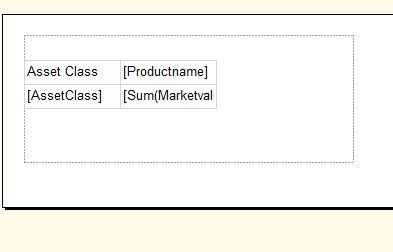
But, the requirement was, there should be 2 product per row, i.e., preview should be as below:
To do this there is no any in build function, so I have found the following method to do from some posted blogs by the genius.
Step 1: Create the custom function: copy the following code to the custom code area.
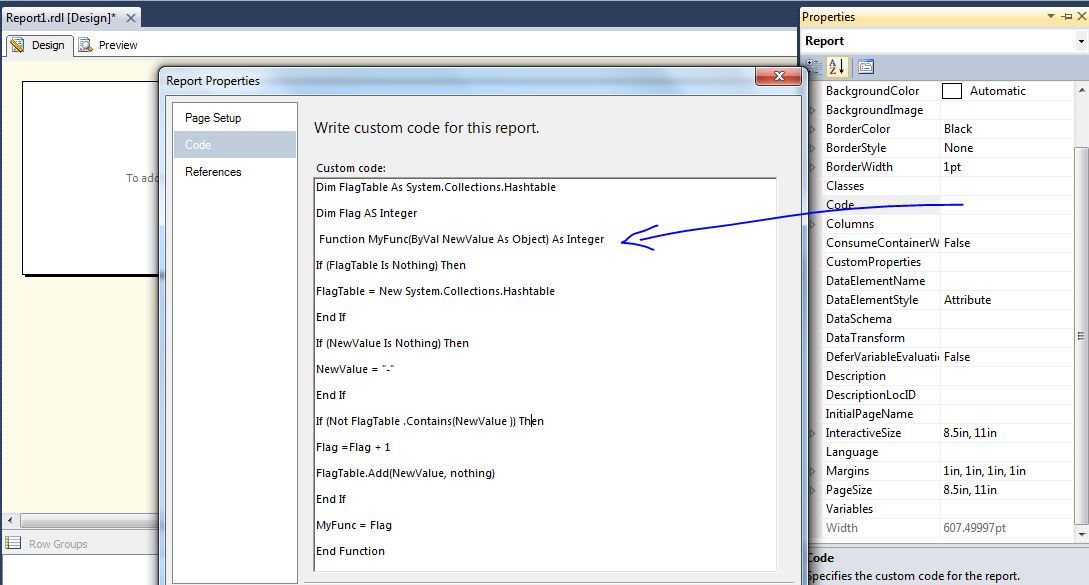
You can copy and paste the below code:
Dim FlagTable As System.Collections.Hashtable
Dim Flag AS Integer
Function MyFunc(ByVal NewValue As Object) As Integer
If (FlagTable Is Nothing) Then
FlagTable = New System.Collections.Hashtable
End If
If (NewValue Is Nothing) Then
NewValue = "-"
End If
If (Not FlagTable .Contains(NewValue )) Then
Flag =Flag + 1
FlagTable.Add(NewValue, nothing)
End If
MyFunc = Flag
End Function
Step 2: Add a list to your report.
1. Right-click the list,and then select Properties.
2. Click Edit details group… button
3. Type in the expression =Ceiling(Code.MyFunc(Fields!Productname.Value)/2)
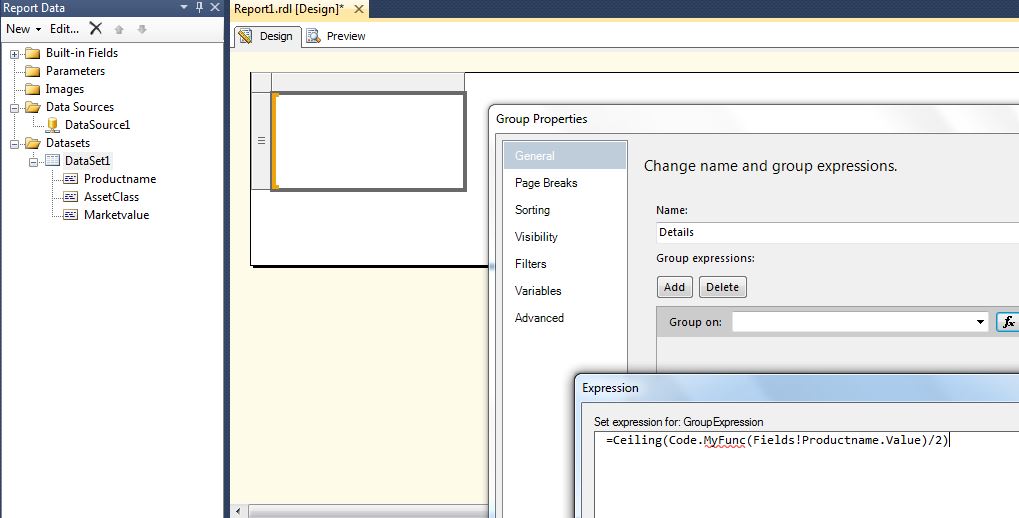
Note:
1) Fields!Productname.Value is your column group data field
2) 2 is the number of the columns you want to display in a row
Step 3: Sort the data set by column group field, and then drag the matrix into the list
The following image shows the data set:
The following image shows the matrix which create the outside the list.
Step 4: Drag the matrix into the list and preview the report. Then preview it will be display as you want.
Cheers!
Its not working
ReplyDelete