It’s important to understand the types of real-time datasets that are designed to display in tiles and dashboards, and how those datasets differ.
There are three types of real-time data sets
Push dataset
Stream dataset
PubNub dataset
Push dataset
With a push data set, data is pushed into Power BI service. When the dataset is created, the Power BI service automatically creates a new database in the service to store the data. Since there is an underlying database that continues to store the data as it comes in, reports can be created with the data. These reports and their visuals are just like any other report visuals, which means you can use all of Power BI’s report building features to create visuals, including Power BI visuals, data alerts, pinned dashboard tiles, and more.
On that dashboard, visuals update in real-time whenever the data is updated. Within the service, the database is triggering a tile refresh every time new data is received.
Streaming dataset
With a stream dataset, data is also pushed into the Power BI service, with an important difference: Power BI only stores the data into a temporary cache, which quickly expires. The temporary case is only used to display visuals, which have some transient sense of history, such a line chart has a time window of one hour.
With a stream dataset, there is no underlying database, so you cannot build report visuals using the data that flows in from the stream. As such, you cannot make use of report functionality such as filtering, Power BI visuals, and other report functions.
The only way to visualize a streaming dataset is to add a tile and use the streaming dataset as a custom streaming data source. The custom streaming tiles that are based on a streaming dataset are optimized for quickly real-time data. There is little latency between when the data is pushed into the Power BI service and when the visual is updated, since there’s no need for the data to be entered into read from a database.
In practice, streaming datasets and their accompanying streaming visuals are best used in situations when it is critical to minimize the latency between when data is pushed and when it is visualized. In addition, it’s best practice to have the data pushed in a format that can be visualized as-is, without any additional aggregation. Examples of data that’s ready as-is include temperature, and pre-calculated averages.
PubNub streaming dataset
PubNub is a Realtime Communication Platform and realtime infrastructure-as-a-service (IaaS) company based in San Francisco, California. With a PubNub streaming dataset, the Power BI web client uses the PubNub SDK to read existing PubNeb data streams.
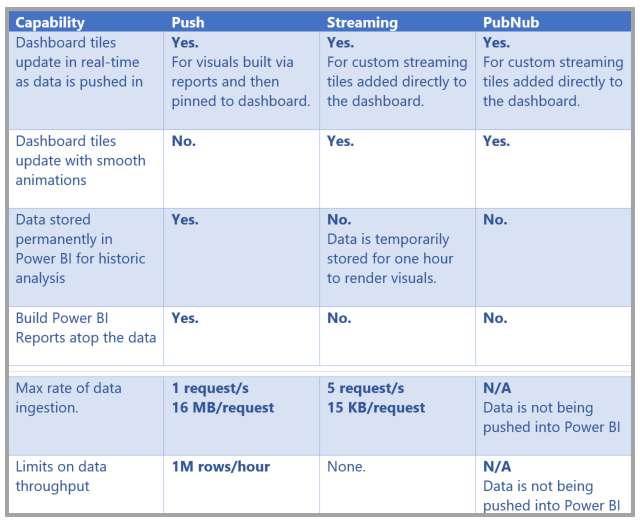
Streaming dataset matrix
Pushing data to datasets
There are three primary ways you can push data into a dataset:
Using the Power BI REST APIs
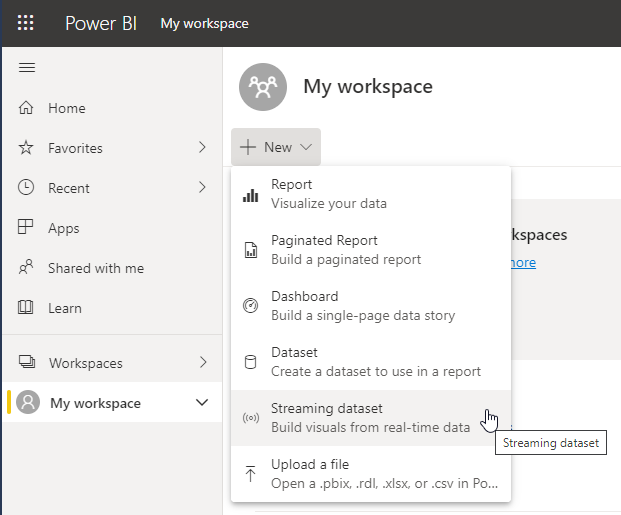
Using the Streaming Dataset UI
Using Azure Stream Analytics


Choose API and define a dataset and define data value from stream. Historical data analysis can be enabled and disabled.
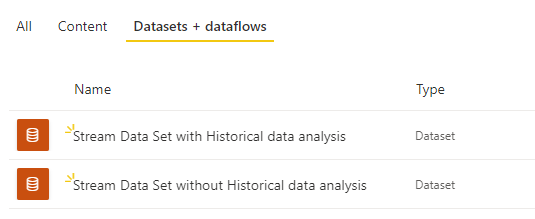
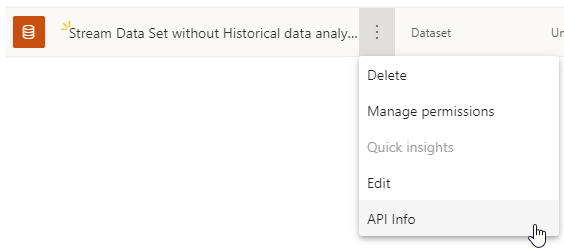
With Historical you can see Create report option is available, and the other one not

As I said previously Stream Data with Historical, allow you to create a report same as other source data.

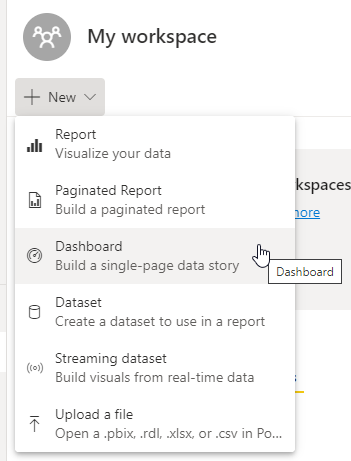
Created a dashboard and add a tile
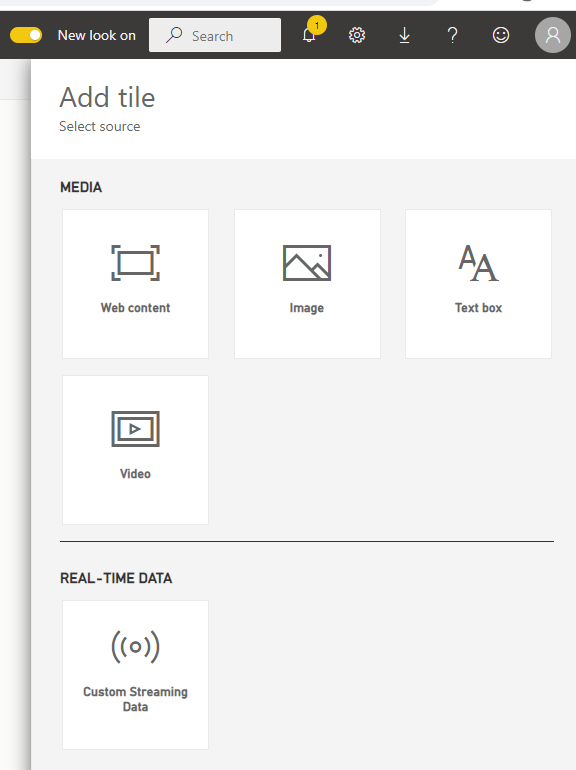
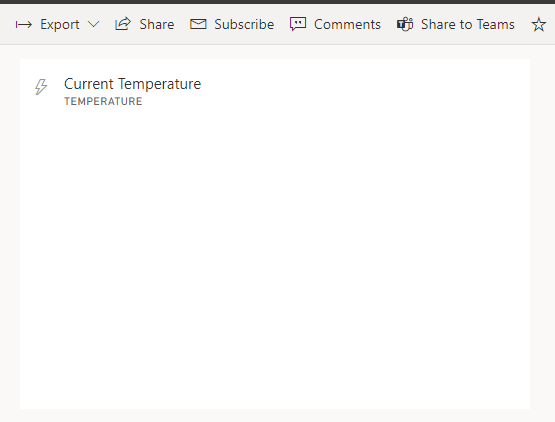
The add an existing Stream data source and choose visualization type


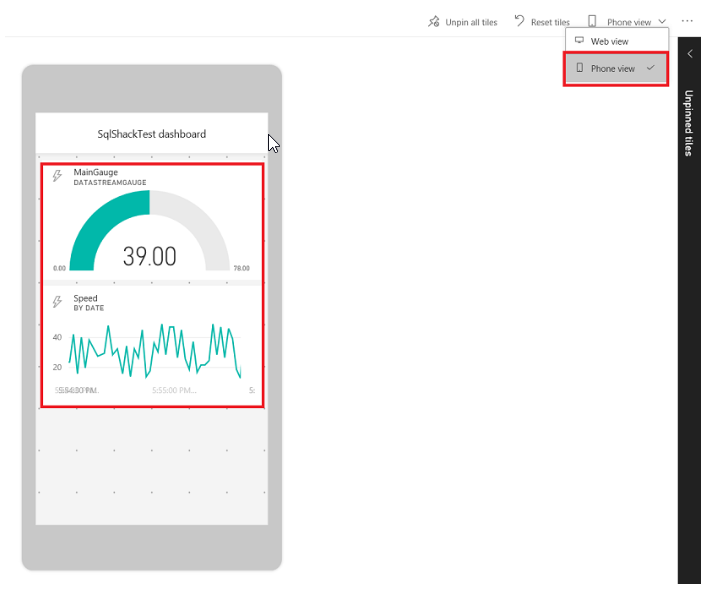
Phone view
Further read:
https://docs.microsoft.com/en-us/power-bi/connect-data/service-real-time-streaming
Cheers
Uma