This blog is about how to use R script and R related features in PowerBI with examples. R server details need to configure in Power BI desktop which includes R Server and R IDE.

Firstly, let’s see how to load data and use this data in PowerBI visualizations.

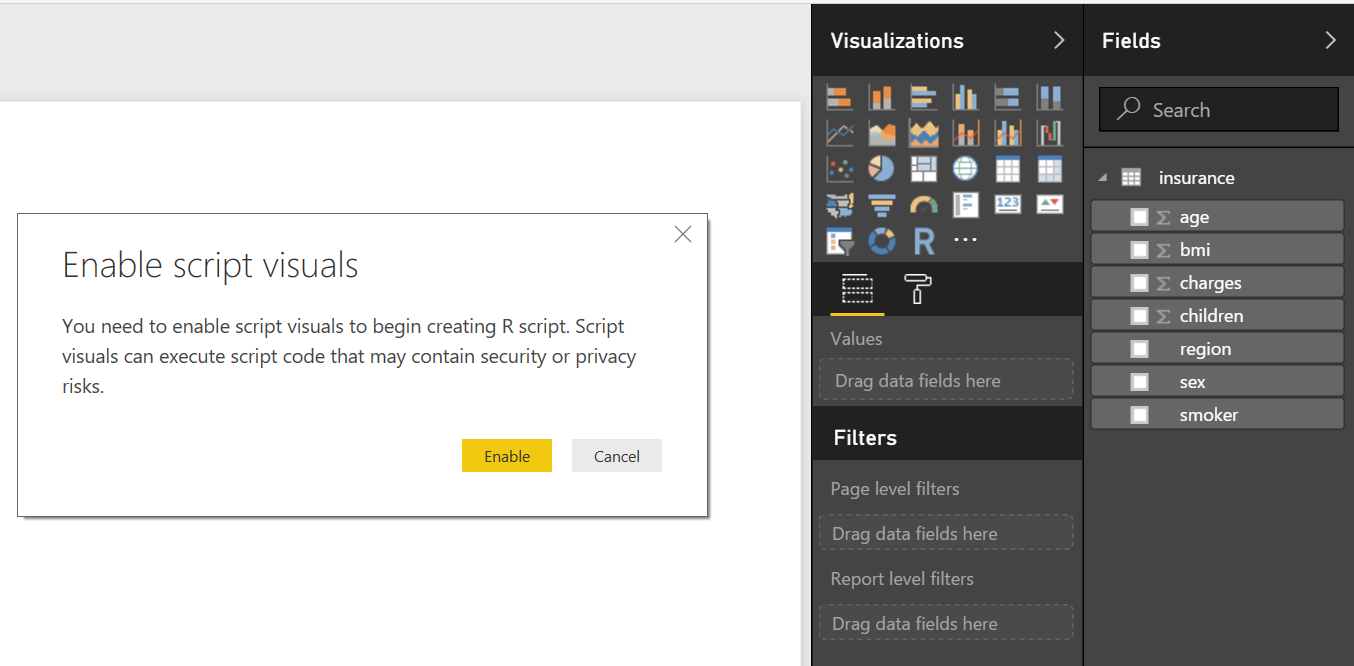
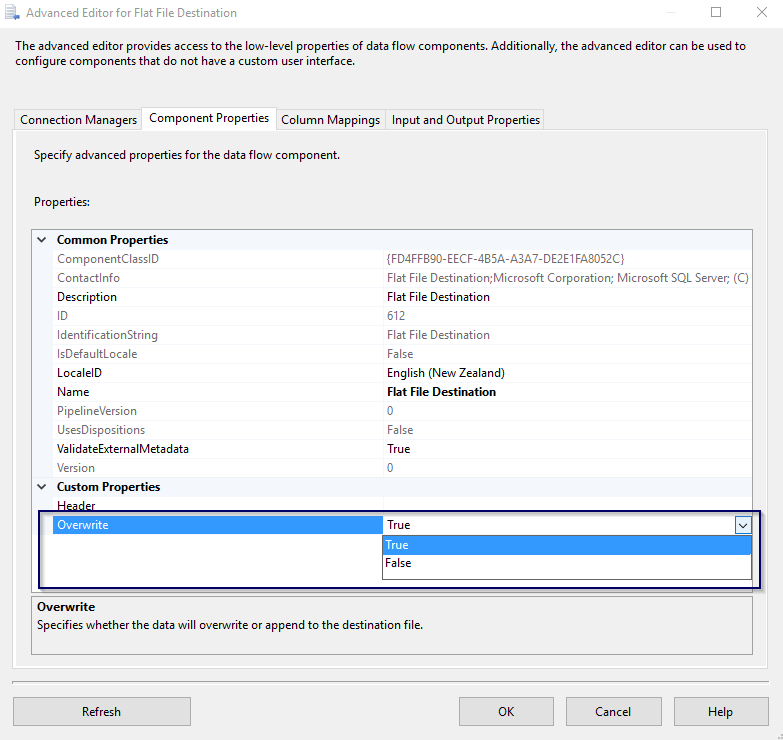
When you select the data, few lines of R script will be generated by default as shown below.

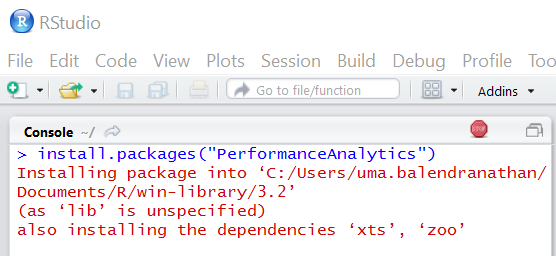
PowerBI is not allow to install any package. You should use external VDI such as R Studio or Visual Studio. In this example, “Performance Analysis” package is installed using R Studio.
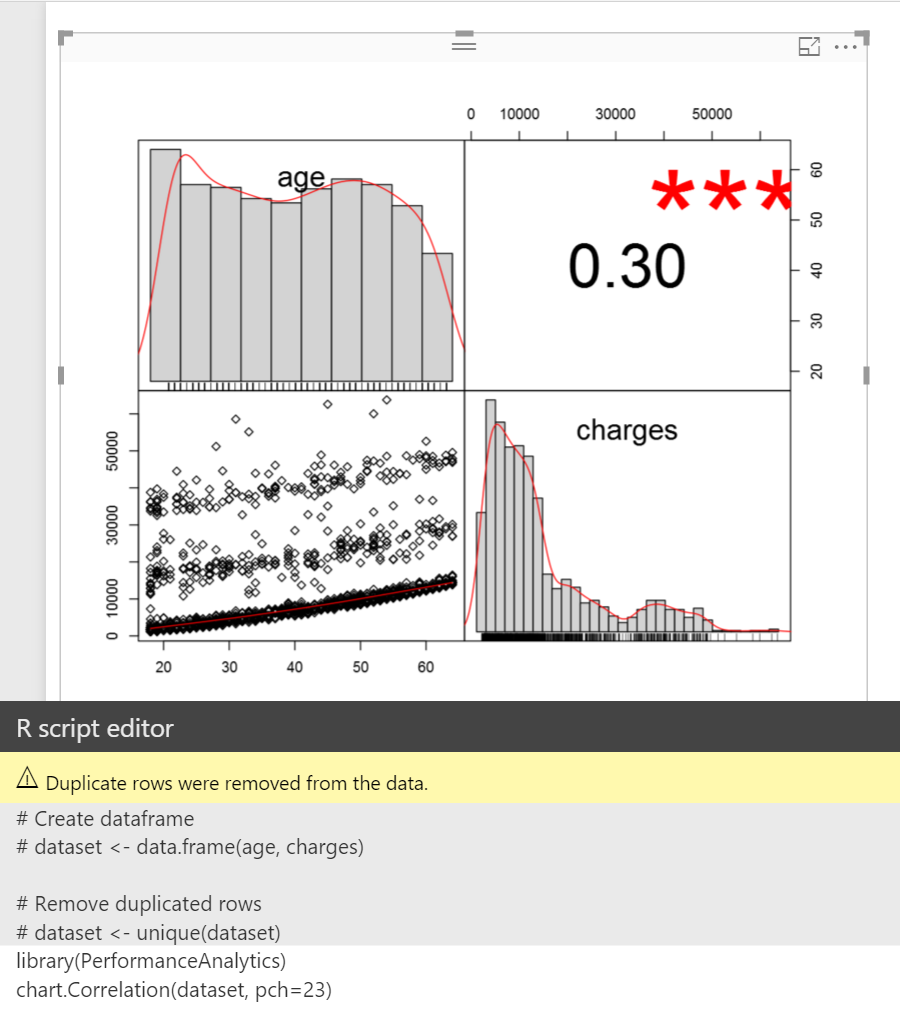
After install the package you can use any functions in this package. The below screenshot shows the correlation between insurance charges against age.
You can interact with data using other visualization components. The below examples show correlation between charge and age when male is a non-smoker.

Now let’s see how to use R Script in dataset level. Before run the script, you might need to configure the Privacy option, otherwise you might get error message as shown below.

Formula.Firewall: Query 'wisc_bc_data' (step 'Run R Script') is accessing data sources that have privacy levels which cannot be used together. Please rebuild this data combination.
Power Query-> Options -> Privacy -> Fast Combine -> check "Ignore the Privacy Levels....
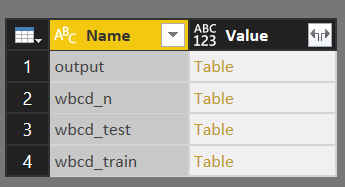
For this example, dataset is normalized first, then prepare train and test data.
He 
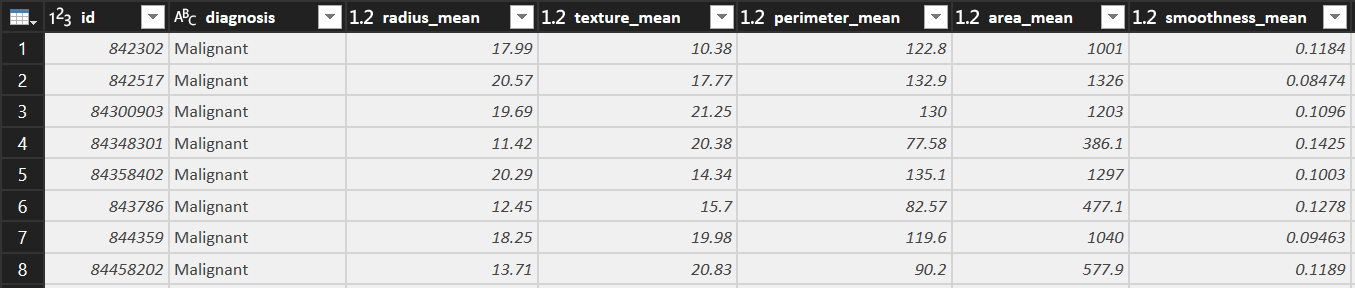
Before normalized
After normalized
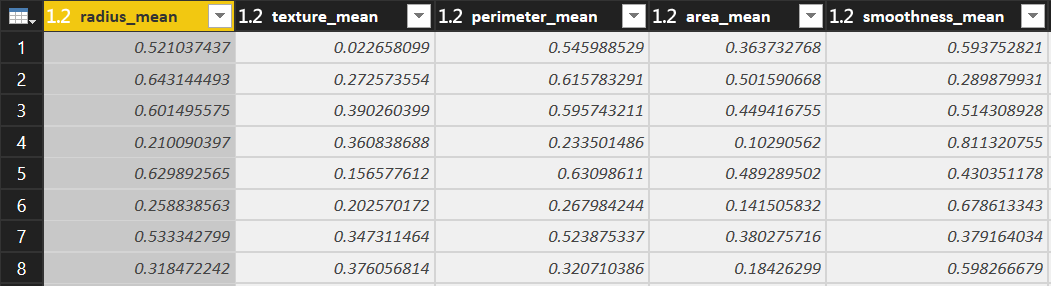
You can be noticed that all the data normalized 0-1.
# 'dataset' holds the input data for this script
normalize <- function(x) { return ((x - min(x)) / (max(x) -min(x))) }
wbcd_n <- as.data.frame(lapply(dataset[3:32], normalize))
# Split data
wbcd_train <- wbcd_n[1:469, ]
wbcd_test <- wbcd_n[470:569, ]
wbcd_train_labels <- dataset[1:469, 2]
wbcd_test_labels <- dataset[470:569, 2]
# Modeling
library("class")
wbcd_test_pred <- knn(train = wbcd_train, test = wbcd_test, cl=wbcd_train_labels, k=21)
# Output
output <- dataset[470:569, ]
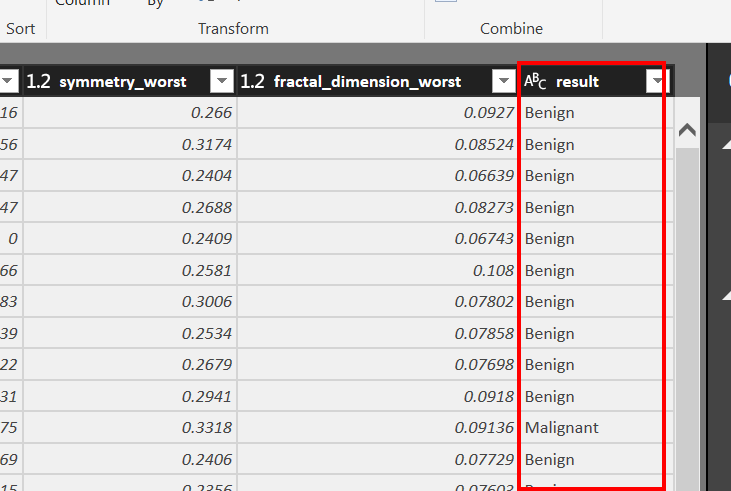
output$result <- wbcd_test_pred
I will clearly explain in another blog post about K nearest neighbors (knn) model. Knn is a simple algorithm that stores all available cases and classifies new cases based on a similarity measure.
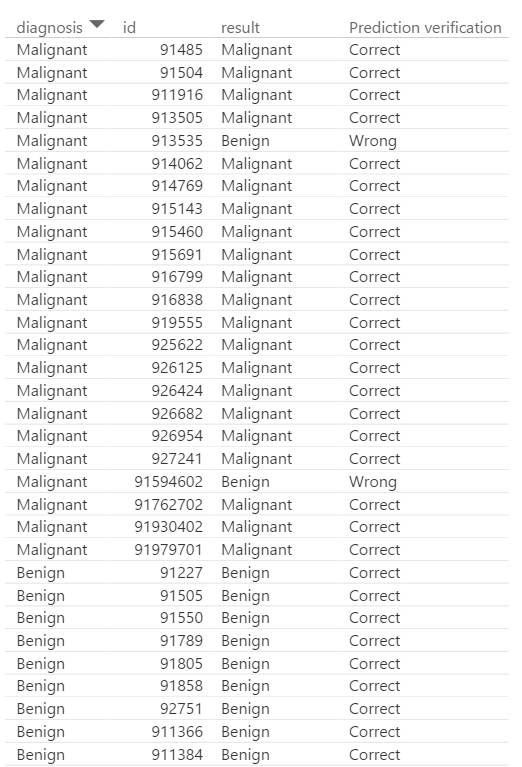
If you click output file, you can see the prediction column with the name of result.
Cheers!
Uma
Uma