Tuesday, October 29, 2013

Introduction to Group for Tablix (Matrix and Table) - Part 3

This post is about how to convert Table into Matrix


One of the key differences between a tablix structured as a table and a tablix structured as a matrix is the Details group. A table usually (but not always) includes the Details group, whereas the matrix eliminates the Details group to display aggregated values only. Therefore, it's necessary to manually remove the detail group from the report to convert the report layout from a table to a matrix.


Drag and drop the Data column into relevant Row/Column Group


Delete the Details Row Group, and then delete the irrelevant headers.


This will shows as below same as matrix:

Cheers!

Introduction to Group for Tablix (Matrix and Table) - Part 2

The post is about the Row and Column grouping using matrix:


1. Add the matrix: Select CalenderYear under Row and the SlaesTerriteryGroup under Column and Sales amount under Data.
The  preview will be as below:


If you want to add more Row group or column group follow the below steps:
The preview will be as below:


We also can swap the column and row group data:
The preview will be as below:


Cheers!


Introduction to Group for Tablix (Matrix and Table) - Part 1

This post is about the basic features of Tablix grouping in SSRS.

Data set and the query that I have used is following:


The following steps illustrates how to create the Grouping:

1. Drag and Drop the matrix

2. Under “Rows” select the CalenderYear and then Under Data select the SalesAmount.


3. Preview will as below:


There are two kind of grouping:
1.       Parent child grouping
2.       Adjacent Before/After grouping


The following images illustrated how the parent child grouping will work:


1. For the previous report, right click on the CalenderYear and select child group under Row group pane:


2. Select SalesTeritoryGroup


3. The design view will be look like beow:


4. The preview will be as below:
The following images illustrated how the Adjacent grouping will work:


1. Add Adjacent After for Calendar year


2. The design view will be as below:


3. Add the sales amount against SalesTerriteryGroup.
4. The preview will be as below:


The following Images show adding total for Parent Child Group:


The following Images show adding total for Adjacent Group:


Cheers!


Monday, October 28, 2013

Configure HTTP Access to Analysis Services on Internet Information Services (IIS) 7.0

This topic explains how to set up HTTP access to an Analysis Services instance using IIS 7.0. These instructions are valid for any supported version or edition of an Analysis Services instance that interfaces with IIS 7.0, including SQL Server 2012, SQL Server 2008 R2, SQL Server 2008, and SQL Server 2005. HTTP access is supported for both tabular mode and multidimensional mode servers.
You can enable HTTP access to Analysis Services by configuring MSMDPUMP.dll, an ISAPI extension that runs in Internet Information Services (IIS) and pumps data to and from client applications and an Analysis Services server. This approach provides an alternative means for connecting to Analysis Services when your BI solution calls for the following capabilities:
  • Client access is over Internet or extranet connections, with restrictions on which ports can be enabled.
  • Client connections are from non-trusted domains in the same network.
  • Client application runs in a network environment that allows HTTP but not TCP/IP connections.
  • Authentication methods other than Windows integrated security are required. Specifically, you can use Anonymous connections and Basic authentication when configuring Analysis Services for HTTP access. Digest, Forms, and ASP.NET authentication are not supported.
  • Client applications cannot use the Analysis Services client libraries (for example, a Java application running on a UNIX server). If you cannot use the Analysis Services client libraries for data access, you can use SOAP and XMLA over a direct HTTP connection to an Analysis Services instance.

MSMDPUMP Overview

MSMDPUMP is an ISAPI extension that loads into IIS and provides redirection to an Analysis Services instance that is on the same computer or a remote computer within the same domain. By configuring this ISAPI extension, you create an HTTP endpoint to an Analysis Services instance.
ISAPI extensions are true applications that run on IIS and have access to all of the functionality provided by IIS. As an example of how powerful ISAPI extensions can be, ASP pages are processed through an ISAPI extension called ASP.dll. In general, clients can access ISAPI extensions the same way they access a static HTML file or dynamic ASP file.
You must create and configure one virtual directory for each HTTP endpoint. Each endpoint will need its own set of MSMDPUMP files, for each Analysis Services instance you want to connect to. A configuration file in this file set specifies the name of the Analysis Services instance used for each HTTP endpoint.
On IIS, MSMDPUMP connects to Analysis Services using the Analysis Services OLE DB provider over TCP/IP. Both Analysis Services and IIS must be in the same domain or in trusted domains in order for the native connection to succeed.
When MSMDPUMP connects to Analysis Services, it does so under a Windows user identity. This account will either be the Anonymous account if you configured the virtual directory for anonymous connections, or a Windows user account. The account must have the appropriate data access rights on the Analysis Services server and database.


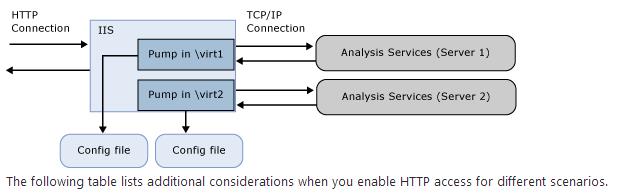
Default folder, where you can find the MSMDPUMP extensions (Under SQL instance installation folder bin path).


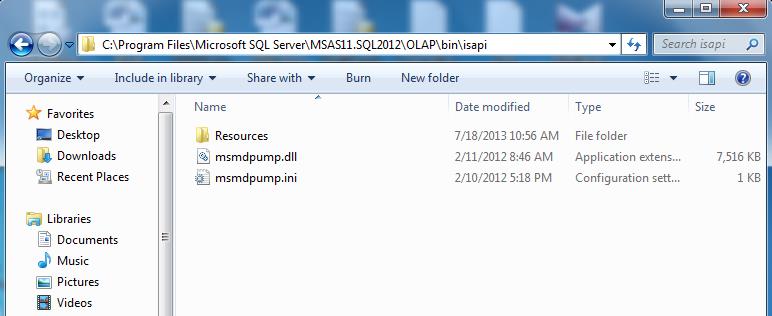
Copy and paste the files where ever you want: (msmdpump.dll, msmdump.ini, Resources folder).


Create the application using the above physical path and make sure you are using Application pool with .Net framework 2.0 and classic as managed pipeline mode.
Screenshot of Add Application Pool dialog


Enabling Windows Authentication:


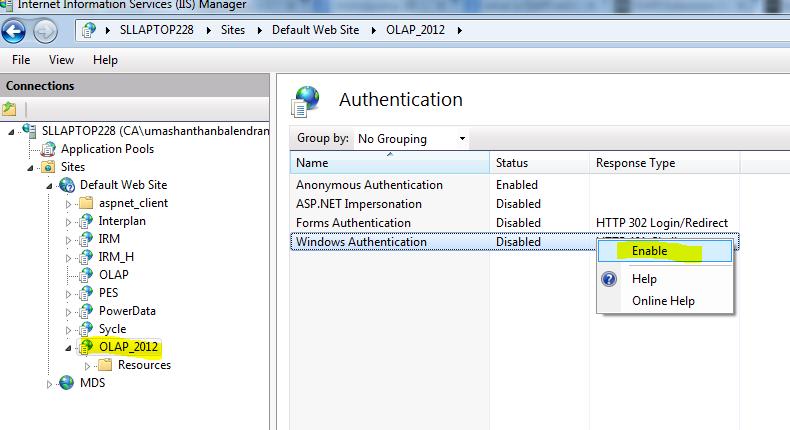
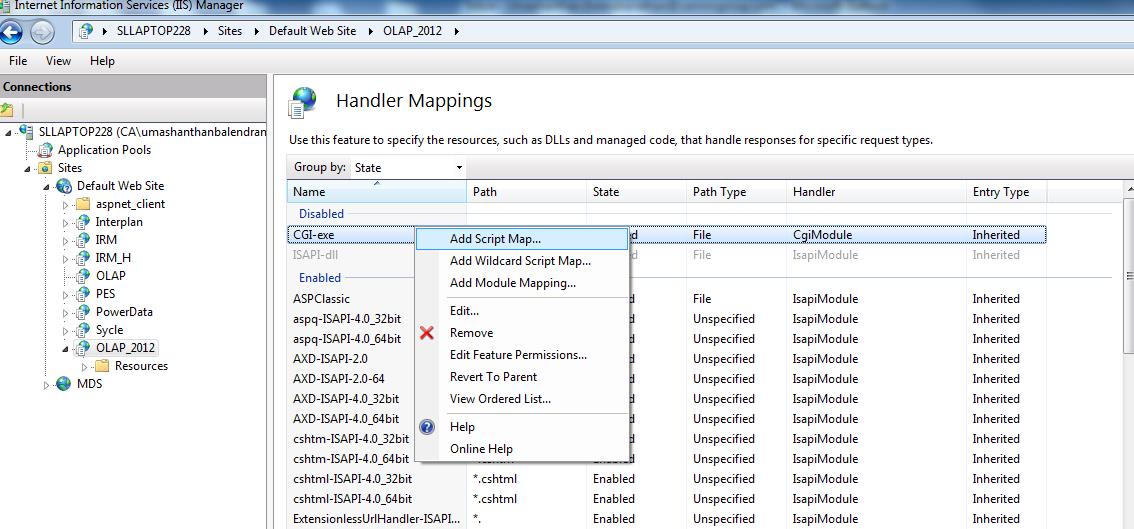
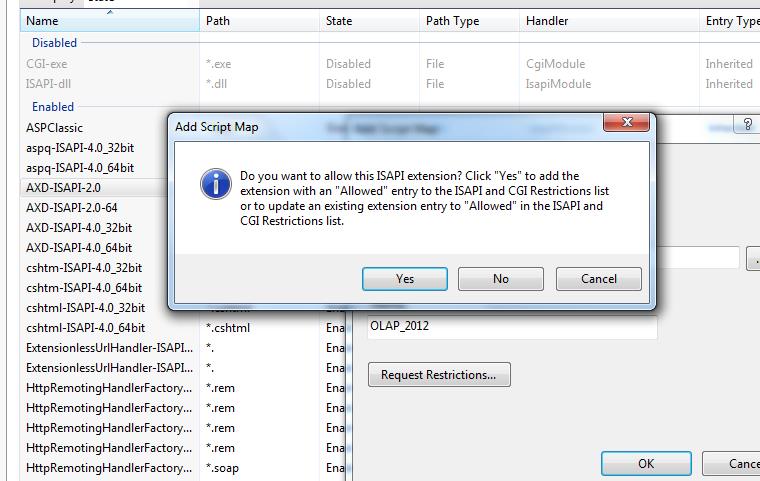
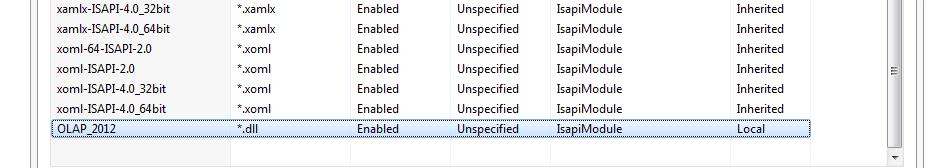
Under Handler Mapping, CGI-exe right clicks Add Script Map: Type same as below (name can be anything) and then click ok and then Yes. The following screenshots are illustrating step by step.


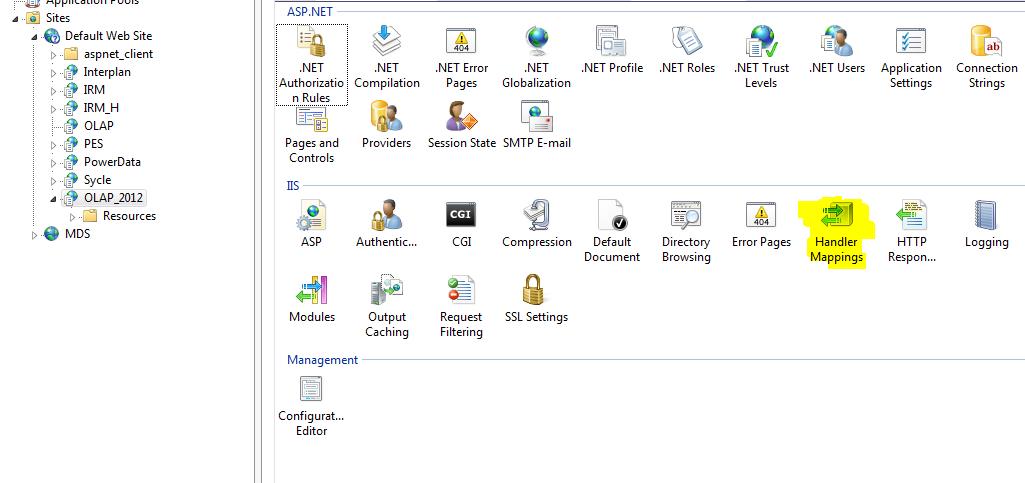
The following image shows the msmdpump.ini configuration file, open the file in notepad and change the SSAS instance name under Server Name tag:


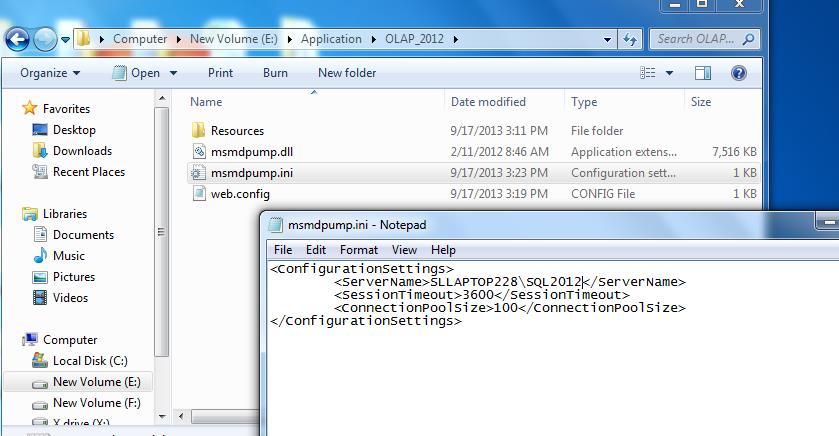
The following image show how to test the SSAS connection, once this connect mean, you are good to go for development!


Reference: http://technet.microsoft.com/en-us/library/gg492140.aspx

Cheers!


Saturday, October 26, 2013

Drill Through Report - SSRS 2012

In this post, I am going to explain about the Drill Through report, with example, for that I am going to use “AdventureWorksDW2012”database.In here the main report will be display the Sales Amount based on the product Category, when click on the particular category it will drill through and display the Sub product Category wise Sales Amount and same as when click on Sub product Category report will be display Product wise sales amount. In Drill Down report, there is a one report, but in Drill-Through report there will be sub report per the drill level.


The data set query that I am going to create the parent report as below:


Add three reports as below:
Edit the Category report and make display Sales Amount group by category and make it Sales Amount as Sum.


Report will be display the preview likes below:


Edit the Sub category Report:


Here we can see that parameter is created:


Now we have to make this parameter value dynamically pass from the category report, for that in the Category report, click on the Category Field, and right click and go the action. And the select Go to report, and select the sub category report under Specify a report, then add the parameter under name all the parameter under sub category report will be display for that  select CategoryKey and for the values select CategoryKey.


If you preview the report you can see the preview will display Hand Tool above the category name. If you click the report one of the category, it will display the sub category report for the only particular category.
For more formatting:
  • Hide the sub report parameter: Click on the parameter and Hide.


  • To make it hyperlink visible to the user make it Blue color, for the category field format as font color as blue and underline.
Do the same steps to Sub Category report to Product report.


Cheers!