This post is about Data Profiling Task in SSIS 2012 and demonstrates how to use this task. The Data Profiling task computes various profiles that help you become familiar with a data source and identity problems in the data that have to be fixed. Mostly, Data Profiling task inside Integration Service package to profile data that is stored in SQL Server and to identify potential problems with data quality.
First drag and drop the Data Profiling Task into the Control Flow.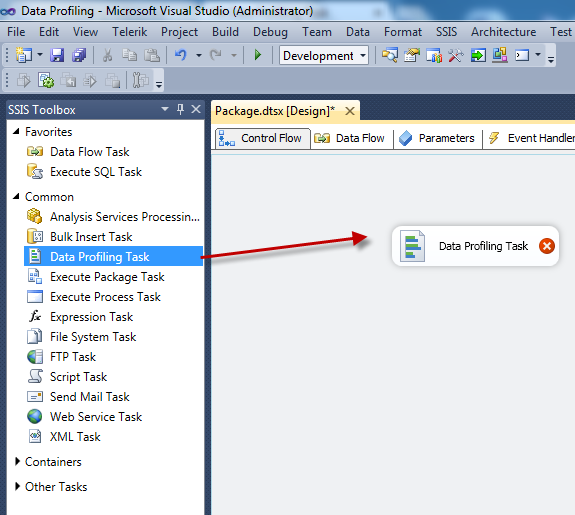
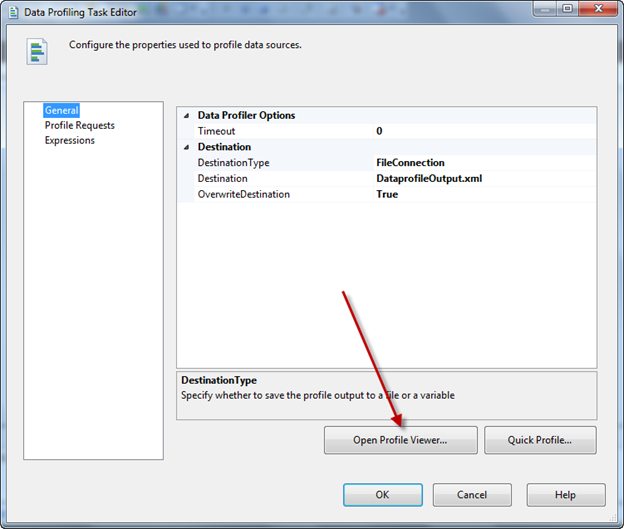
Next, double click on this task and configure the destination file, output comes as XML format. Optionally, if you want make it File Overwrite as True and if file does not exist then create it every time.
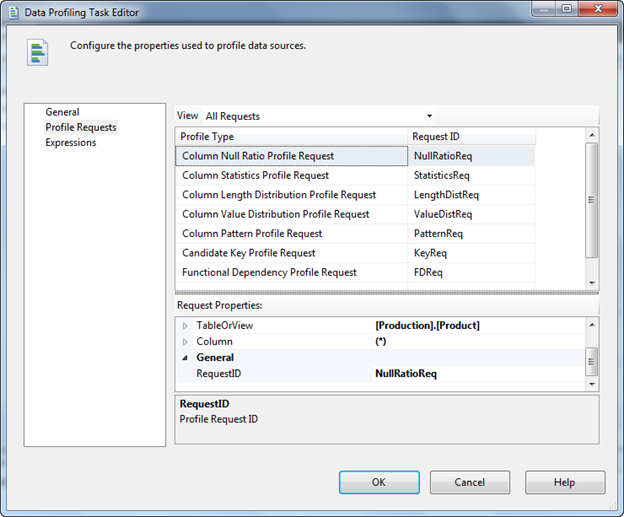
You can make use Quick profile wizard to configure the request profiles.
Once you click on it, it will prompt the below screen, there connect to the source server and select target Table or View and then select the compute options as you per your requirement. Once you have done this profile request will be as below, here you can do the changes individually such as change the table or select the column.
The following five profiles analyze individual columns.
Profiles that analyze individual columns
|
Description
|
Column Length Distribution Profile
|
Reports all the distinct lengths of string values in the selected column and the percentage of rows in the table that each length represents.
This profile helps you identify problems in your data, such as values that are not valid. For example, you profile a column of United States state codes that should be two characters and discover values longer than two characters.
|
Column Null Ratio Profile
|
Reports the percentage of null values in the selected column.
This profile helps you identify problems in your data, such as an unexpectedly high ratio of null values in a column. For example, you profile a Zip Code/Postal Code column and discover an unacceptably high percentage of missing codes.
|
Column Pattern Profile
|
Reports a set of regular expressions that cover the specified percentage of values in a string column.
This profile helps you identify problems in your data, such as string that are not valid. This profile can also suggest regular expressions that can be used in the future to validate new values. For example, a pattern profile of a United States Zip Code column might produce the regular expressions: \d{5}-\d{4}, \d{5}, and \d{9}. If you see other regular expressions, your data likely contains values that are not valid or in an incorrect format.
|
Column Statistics Profile
|
Reports statistics, such as minimum, maximum, average, and standard deviation for numeric columns, and minimum and maximum fordatetime columns.
This profile helps you identify problems in your data, such as dates that are not valid. For example, you profile a column of historical dates and discover a maximum date that is in the future.
|
Column Value Distribution Profile
|
Reports all the distinct values in the selected column and the percentage of rows in the table that each value represents. Can also report values that represent more than a specified percentage of rows in the table.
This profile helps you identify problems in your data, such as an incorrect number of distinct values in a column. For example, you profile a column that is supposed to contain states in the United States and discover more than 50 distinct values.
|
The following three profiles analyze multiple columns or relationships between columns and tables.
Profiles that analyze multiple columns
|
Description
|
Candidate Key Profile
|
Reports whether a column or set of columns is a key, or an approximate key, for the selected table.
This profile also helps you identify problems in your data, such as duplicate values in a potential key column.
|
Functional Dependency Profile
|
Reports the extent to which the values in one column (the dependent column) depend on the values in another column or set of columns (the determinant column).
This profile also helps you identify problems in your data, such as values that are not valid. For example, you profile the dependency between a column that contains United States Zip Codes and a column that contains states in the United States. The same Zip Code should always have the same state, but the profile discovers violations of this dependency.
|
Value Inclusion Profile
|
Computes the overlap in the values between two columns or sets of columns. This profile can determine whether a column or set of columns is appropriate to serve as a foreign key between the selected tables.
This profile also helps you identify problems in your data, such as values that are not valid. For example, you profile the ProductID column of a Sales table and discover that the column contains values that are not found in the ProductID column of the Products table.
|
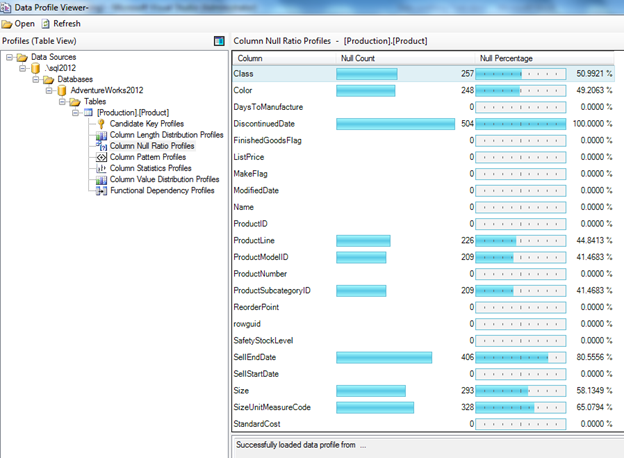
Run the Package, and locate to the file location, you will the xml file will be created. Alternatively you can open the profile task and click on Open Profile Viewer; this is the interface to view the profile in appropriate way.
Here you will be able to see all the relevant details.
Requirements and Limitations:
The Data Profiling task works only with data that is stored in SQL Server. This task does not work with third-party or file-based data sources.
Furthermore, to run a package that contains the Data Profiling task, you must use an account that has read/write permissions, including CREATE TABLE permissions, on the tempdb database.
(More details: http://technet.microsoft.com/en-us/library/bb895263.aspx)
No comments:
Post a Comment