Predictive analytics involves extracting data from existing data sets with the goal of identifying trends and patterns. These trends and patterns are then used to predict future outcomes and trends. In this post, I am trying to explain how to use Predictive Analysis using Microsoft SQL Server R service.
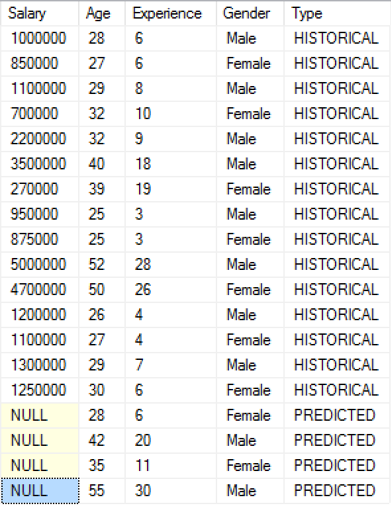
In this example, salary will be predicted based on other know fields age, experience and gender.
Using R Studio
First, let’s see how to use R Studio for this prediction
-- Set the default path
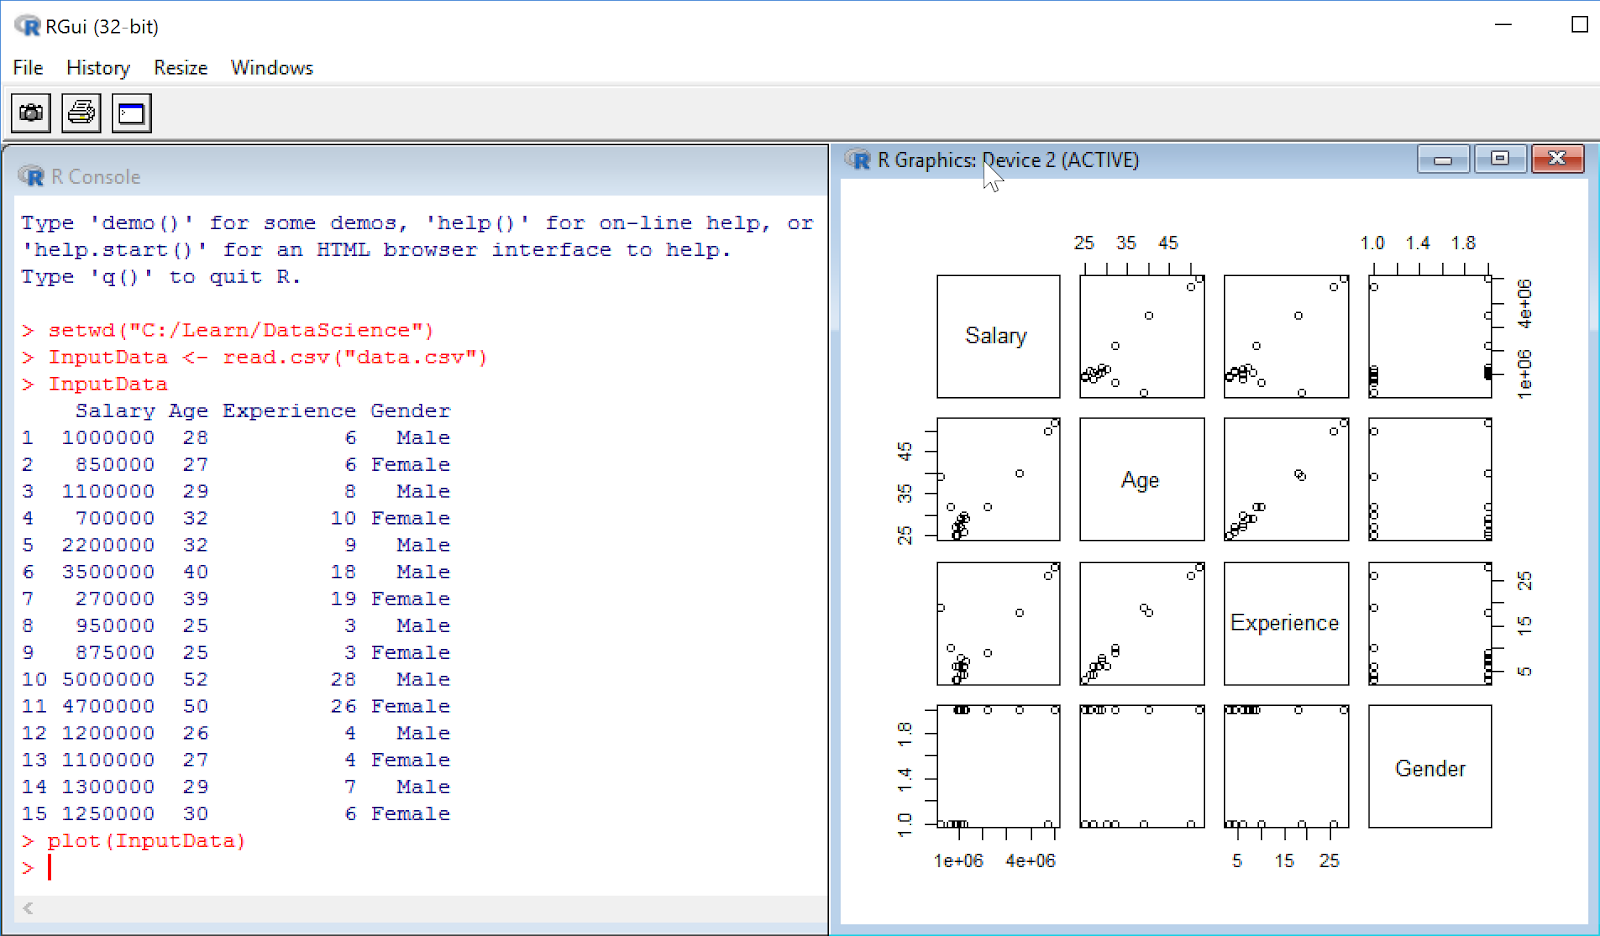
> setwd("C:/Learn/DataScience")
-- Load data from csv file to variable called InputData
> InputData <- read.csv("data.csv")
For this prediction Linear Regression is going to used. There are mainly 2 type of linear regressions used.
Simple Linear Regression
Multiple Linear Regression
Simple Linear Regression
Simple linear regression is a statistical method that allows us to summarize and study relationships between two continuous (quantitative) variables:
• One variable, denoted x, is regarded as the predictor, explanatory, or independent variable.
• The other variable, denoted y, is regarded as the response, outcome, or dependent variable.
Because the other terms are used less frequently today, we'll use the "predictor" and "response" terms to refer to the variables encountered in this course. The other terms are mentioned only to make you aware of them should you encounter them in other arenas. Simple linear regression gets its adjective "simple," because it concerns the study of only one predictor variable. In contrast, multiple linear regression, which we study later in this course, gets its adjective "multiple," because it concerns the study of two or more predictor variables.
Multiple Linear Regression
We move from the simple linear regression model with one predictor to the multiple linear regression model with two or more predictors. That is, we use the adjective "simple" to denote that our model has only predictor, and we use the adjective "multiple" to indicate that our model has at least two predictors.
Please read more information here.
R provides comprehensive support for linear regression.
lm() is a linear model function, such like linear regression analysis.
lm(formula, data, subset, weights, ...)
formula: model description, such as x ~ y
data: optional, variables in the model
subset: optional, a subset vector of observations to be used in the fitting process
weights: optional, a vector of weights to be used in the fitting process
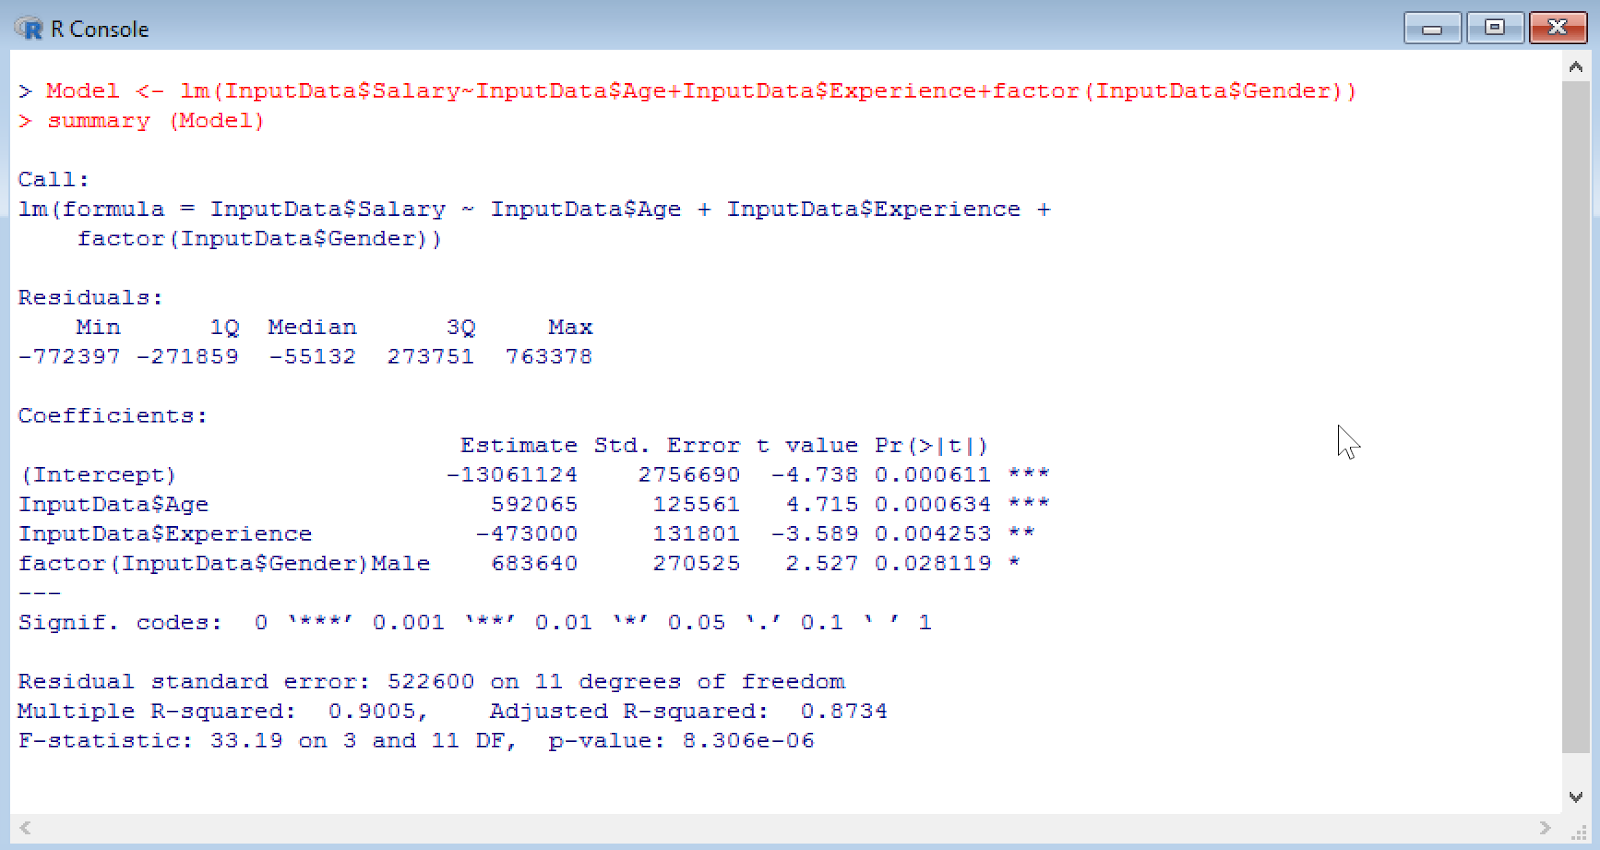
> Model <- lm(InputData$Salary~InputData$Age+InputData$Experience+factor(InputData$Gender))
> summary (Model)
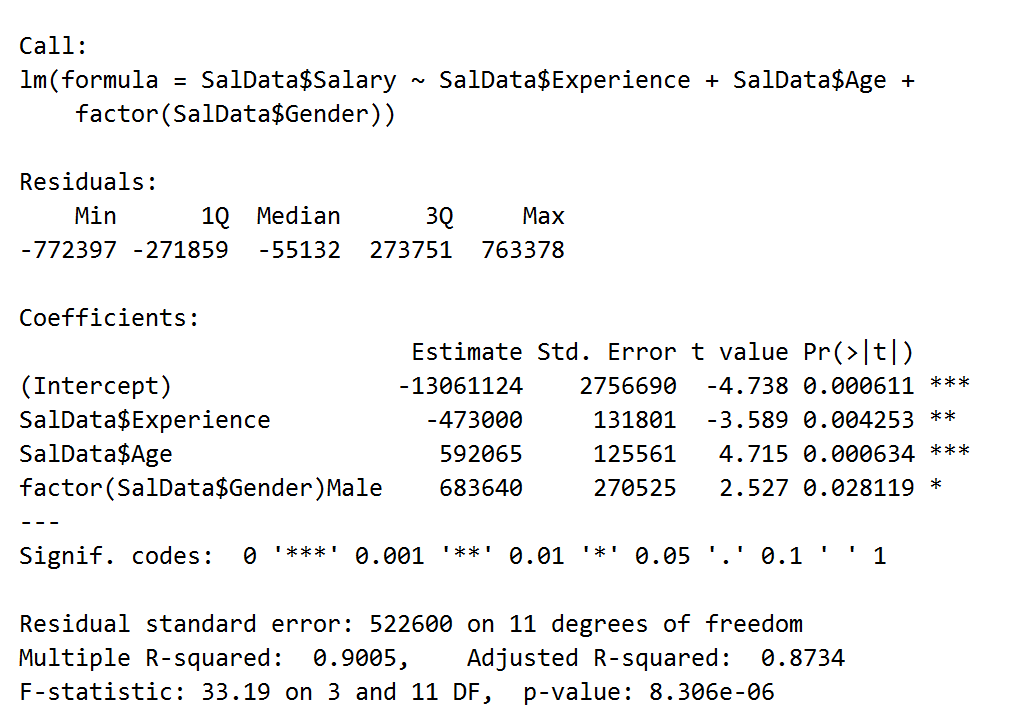
The important part of model out is highlighted below.
InputData$Salary~InputData$Age+InputData$Experience+factor(InputData$Gender)
You can have noticed that Gender field is used as factor, so the interpretation of the above outcome.
If Gender = Male, Then
Salary = (-13061124) + (-473000 * PredictSal$Experience) + (592065 * PredictSal$Age) + 683640
If Gender = Female, Then
Salary = (-13061124) + (-473000 * PredictSal$Experience) + (592065 * PredictSal$Age)
Visual Studio
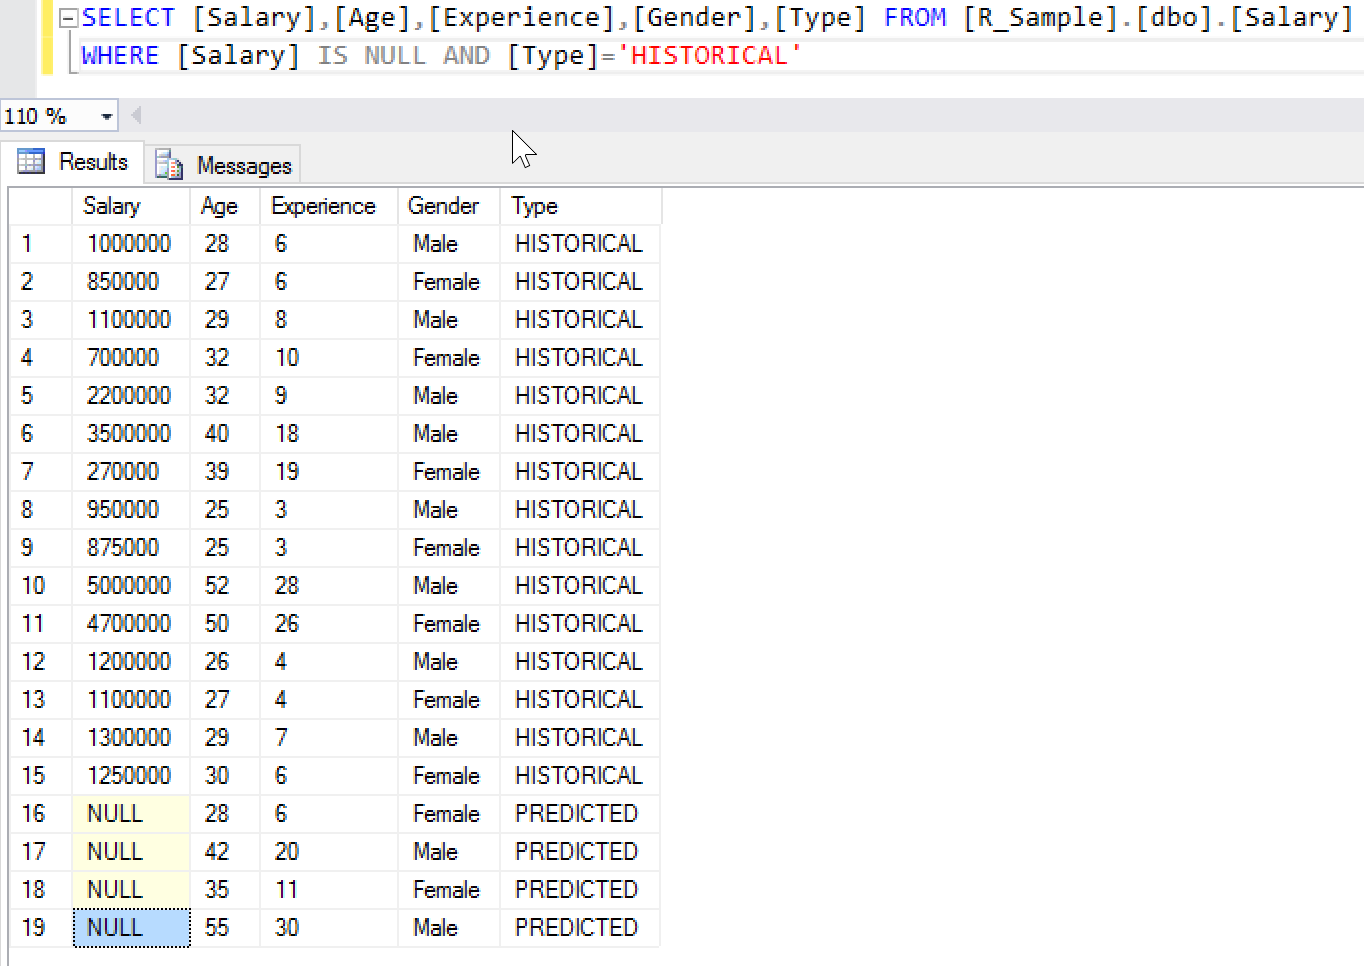
Now let’s see how to use Visual Studio instead of R Studio with SQL Server. The below image shows that how the data is stored in a table in SQL Server database.
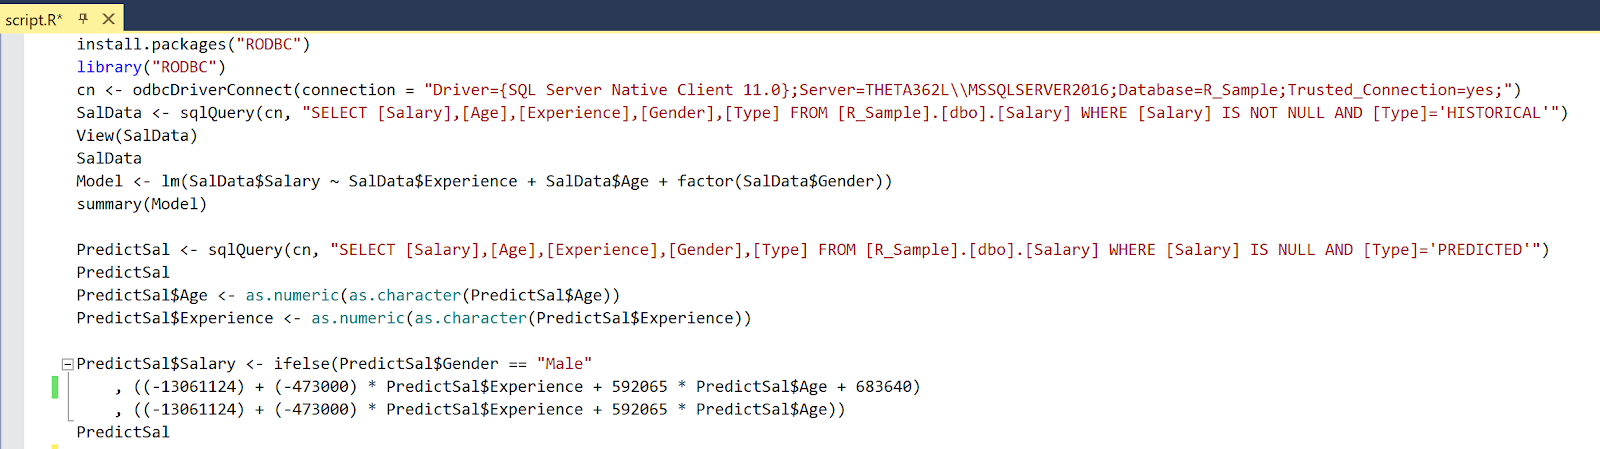
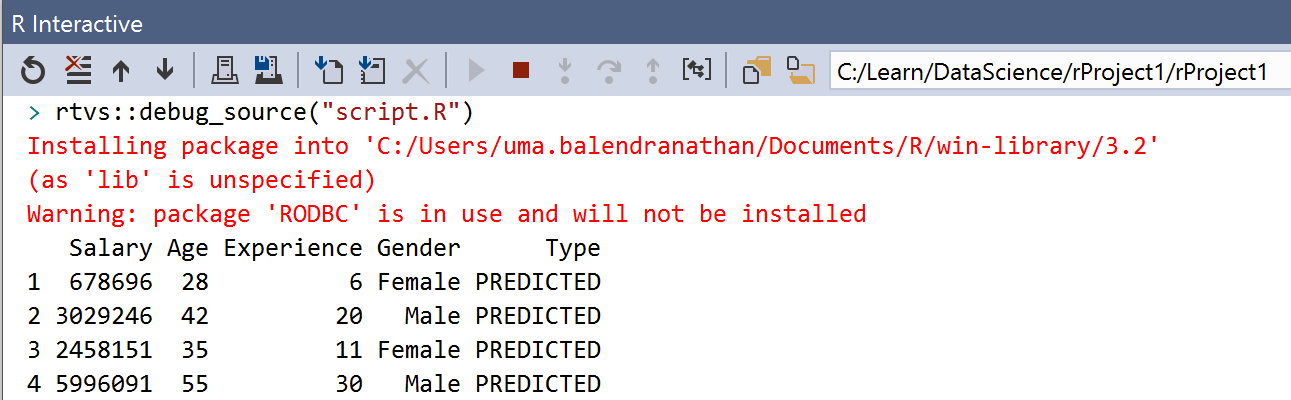
To following screenshots shows the prediction in Visual studio
<Code>
install.packages("RODBC")
library("RODBC")
cn <- odbcDriverConnect(connection = "Driver={SQL Server Native Client 11.0};Server=THETA362L\\MSSQLSERVER2016;Database=R_Sample;Trusted_Connection=yes;")
SalData <- sqlQuery(cn, "SELECT [Salary],[Age],[Experience],[Gender],[Type] FROM [R_Sample].[dbo].[Salary] WHERE [Salary] IS NOT NULL AND [Type]='HISTORICAL'")
View(SalData)
SalData
Model <- lm(SalData$Salary ~ SalData$Experience + SalData$Age + factor(SalData$Gender))
summary(Model)
PredictSal <- sqlQuery(cn, "SELECT [Salary],[Age],[Experience],[Gender],[Type] FROM [R_Sample].[dbo].[Salary] WHERE [Salary] IS NULL AND [Type]='PREDICTED'")
PredictSal
PredictSal$Age <- as.numeric(as.character(PredictSal$Age))
PredictSal$Experience <- as.numeric(as.character(PredictSal$Experience))
PredictSal$Salary <- ifelse(PredictSal$Gender == "Male"
, ((-13061124) + (-473000) * PredictSal$Experience + 592065 * PredictSal$Age + 683640)
, ((-13061124) + (-473000) * PredictSal$Experience + 592065 * PredictSal$Age))
PredictSal
Using SQL Server Management Studio
You can run the R code in SQL Server Management studio via external script. You need to follow the below steps to run the R script.
First configure the SQL Server and restart to enable to run the external scripts
sp_configure
GO
sp_configure 'external scripts enabled',1;
GO
RECONFIGURE
GO
If you get the following error message while you run the R script please make sure you enable the Lunch Pad.
SQL Server was unable to communicate with the LaunchPad service. Please verify the configuration of the service.
Administrative Tools -> Services
and find "SQL Server LaunchPad (MSSQLSERVER)"
right-click it and select "Start" and my scripts run again.
Create the stored procedure as shown below
CREATE PROCEDURE dbo.PredictSalary
AS
BEGIN
EXEC sp_execute_external_script
@language = N'R'
,@script = N'
PredictSal <- InputDataSet
PredictSal <- setNames(PredictSal, c("Age","Experience","Gender"))
PredictSal$Age <- as.numeric(as.character(PredictSal$Age))
PredictSal$Experience <- as.numeric(as.character(PredictSal$Experience))
PredictSal$Salary <-0
PredictSal$Salary <- ifelse(PredictSal$Gender == "Male"
, ((-13061124) + ((-473000) * PredictSal$Experience) + (592065 * PredictSal$Age) + 683640)
, ((-13061124) + ((-473000) * PredictSal$Experience) + (592065 * PredictSal$Age)))
OutputDataSet <- PredictSal'
,@input_data_1 = N'SELECT [Age],[Experience],[Gender] FROM [R_Sample].[dbo].[Salary] WHERE [Salary] IS NULL AND [Type]=''PREDICTED'''
,@output_data_1_name = N'OutputDataSet'
WITH RESULT SETS ((
"Age" INT NOT NULL,
"Experience" FLOAT NOT NULL,
"Gender" VARCHAR(10) NOT NULL,
"Salary" INT NOT NULL));
END
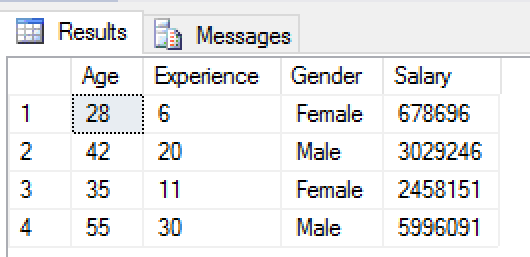
If you run the stored procedure, you will find the outcome as shown below.
EXEC dbo.PredictSalary
You can add the following logic to update prediction outcome automatically into the table.
CREATE TABLE #TEMP (Age INT, Experience INT, Gender VARCHAR(10), Salary INT)
GO
INSERT INTO #TEMP
EXEC dbo.PredictSalary
GO
SELECT * FROM #TEMP
GO
UPDATE E
SET E.Salary=T.Salary
FROM dbo.Salary E INNER JOIN #TEMP T ON E.Age=T.Age AND E.Experience=T.Experience AND E.Gender=T.Gender
WHERE E.Salary IS NULL AND E.Type ='PREDICTED'
The table will get update once you run the script.
Cheers!
Uma
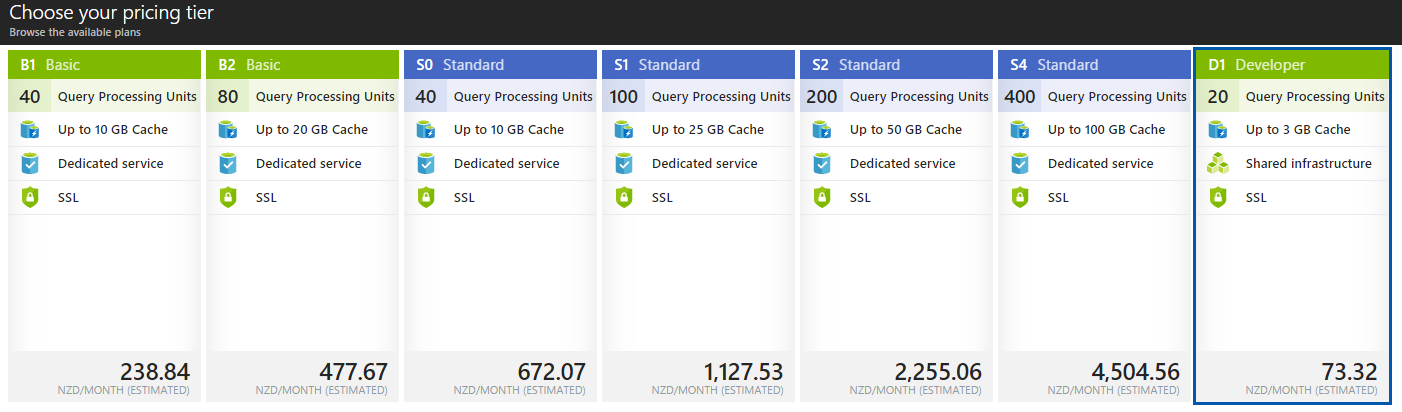 Step1: Create Azure Analysis Service

 Step2: Create an Azure SQL DB
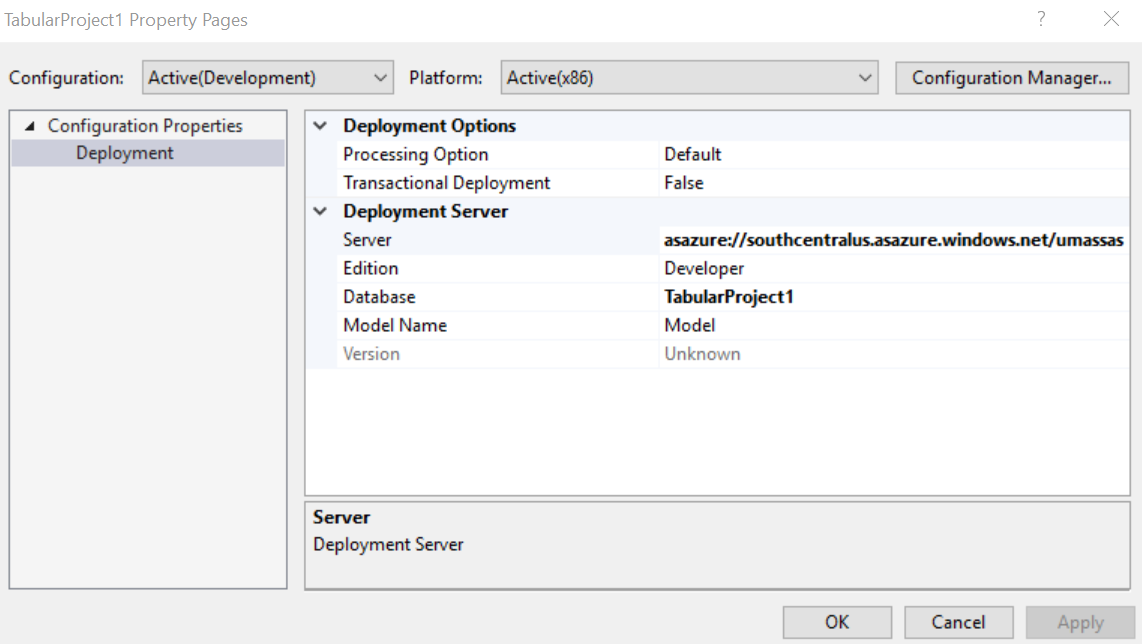
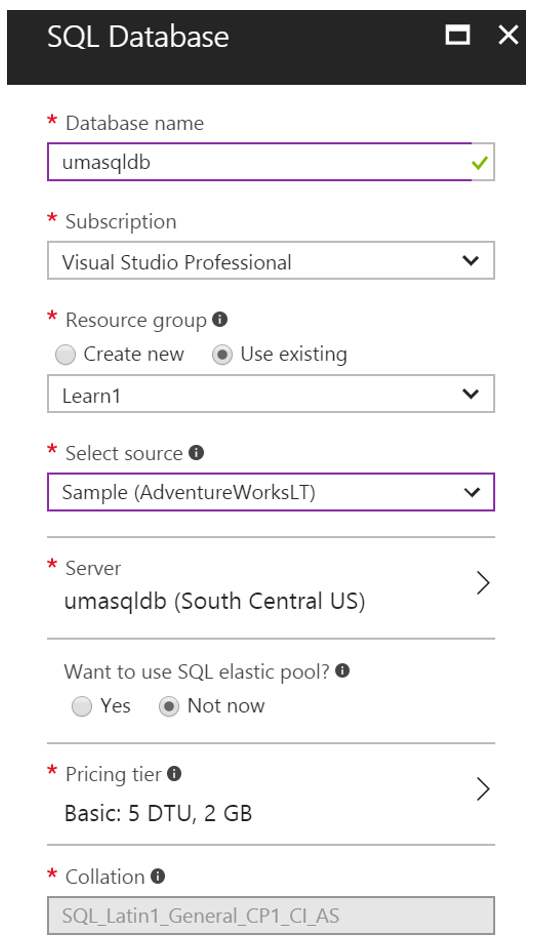 Step3: Connect Azure Analysis Service using Visual Studio


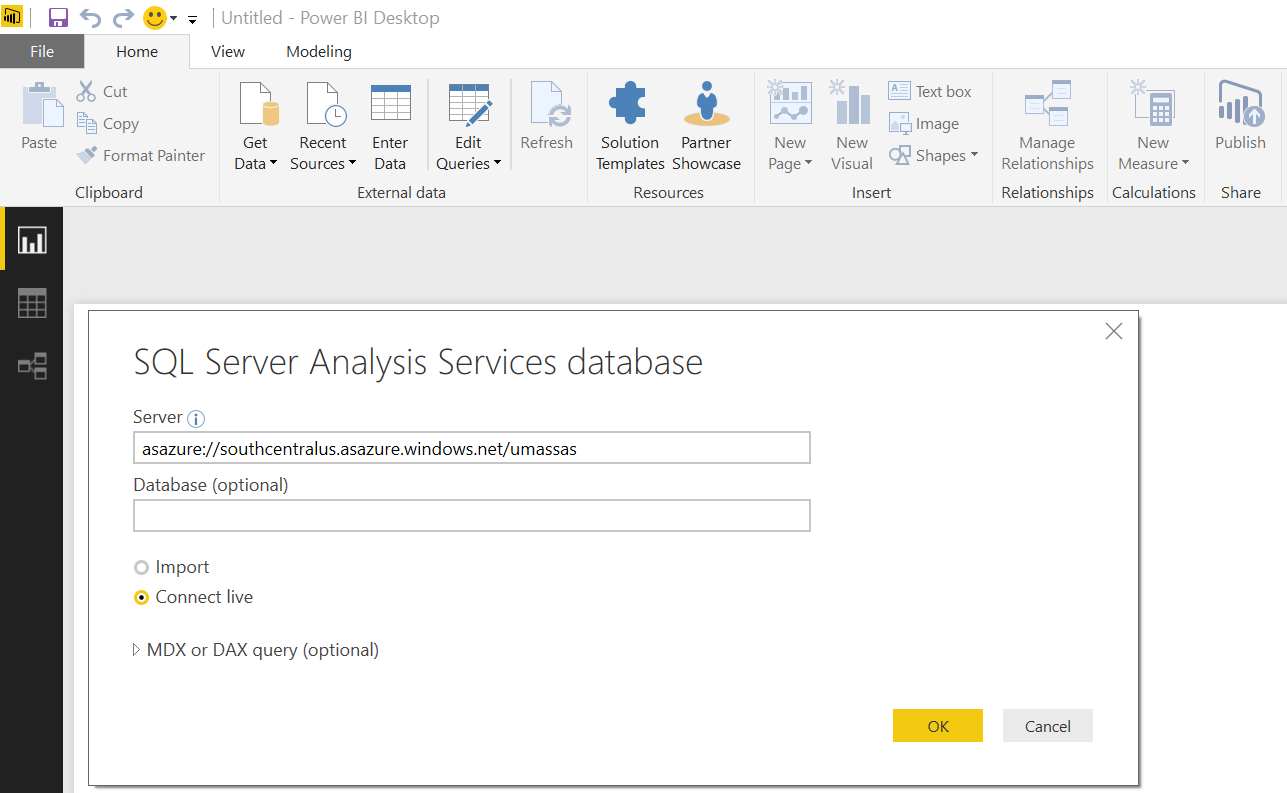
 Step4: Select Databases/SQL Server Analysis Services and then connect
 Cheers!
Uma
Cheers!
Uma