Showing posts with label PowerBI. Show all posts

Saturday, January 25, 2020

How to brand PowerBI Report Server

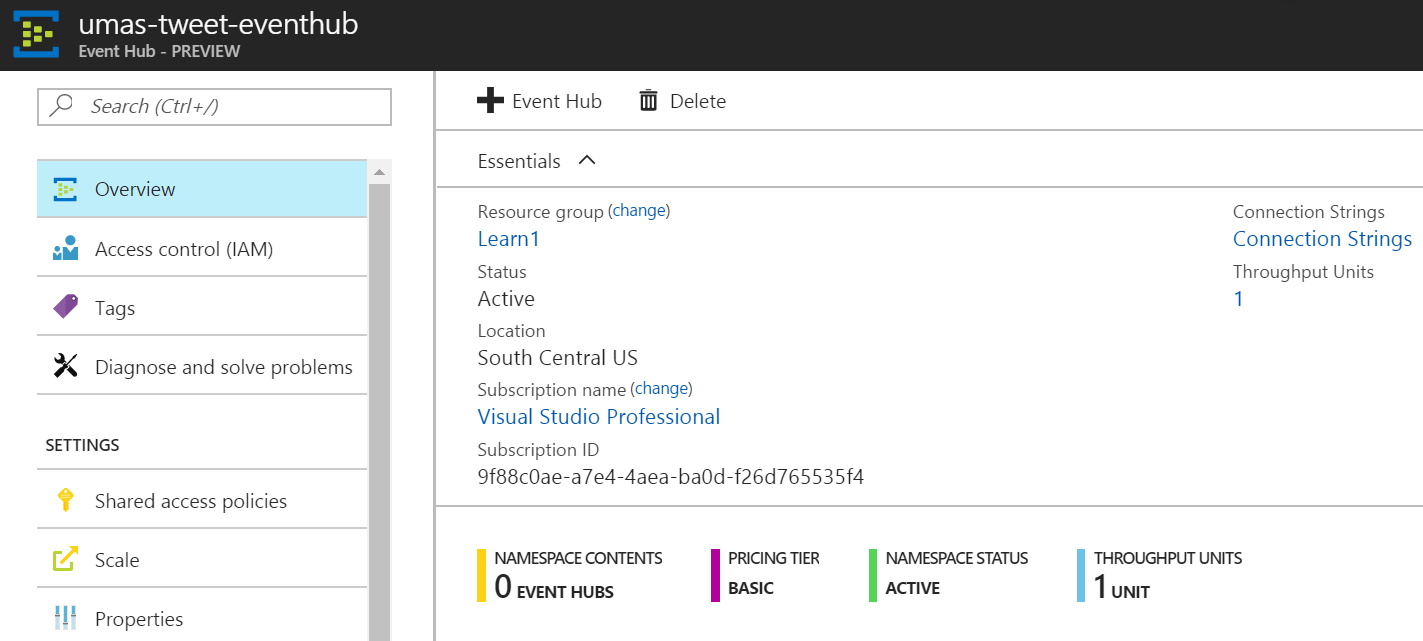
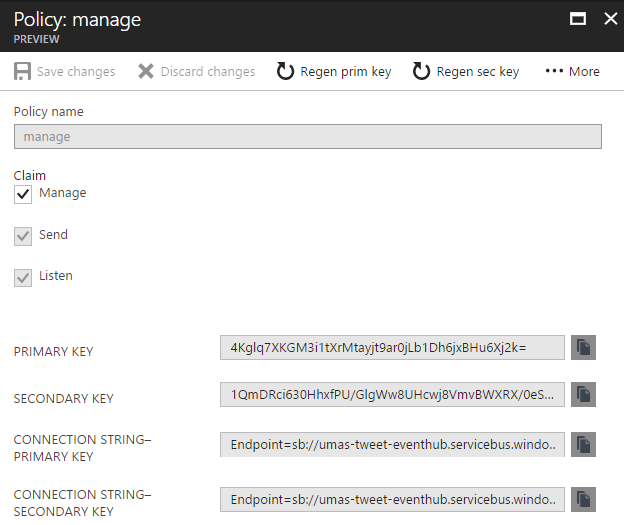
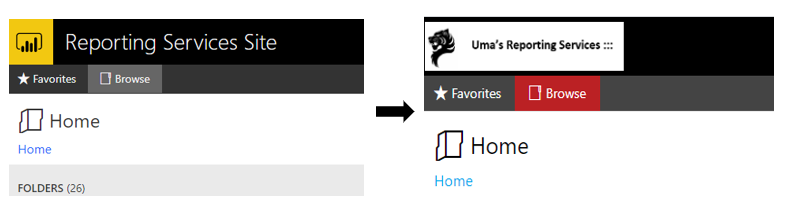
One of the coolest features of SQL Server Report Server is branding/customizing the report server web portal.  This feature was introduced in SQL Server 2016. We can do the same branding in PowerBI Report Server as well. In terms of the process there are no changes between SSRS and PowerBI report server branding.
Before and after branding
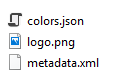
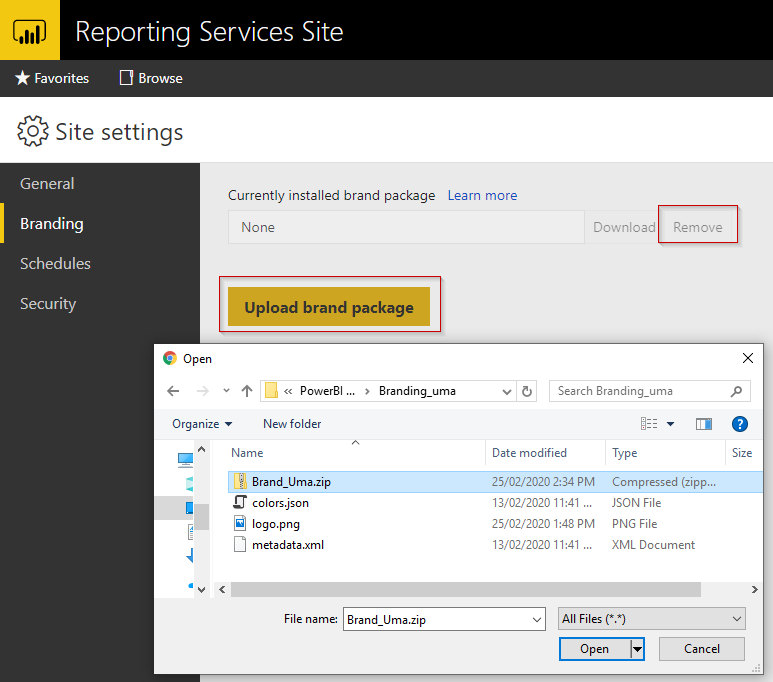
Let’s see the steps needed to follow. A brand package for reporting services consists of three files in a zip file.
  • Metadata.xml - The metadata.xml file allows you to set the name of the brand package, and has a reference entry for both your colors.json and logo.png files
  • Color.json - When the brand package is uploaded, the server extracts the appropriate name/value pairs from the colors.json file and merges them with the master LESS stylesheet, brand.less. This LESS file is then processed, and the resulting CSS file is served to the client. All colors in the stylesheet follow the six-character hexadecimal representation of a color
  • Logo.png – This is just an logo image. The logo file should be in png format

If you already have standard branding files, your job would be much easier, just a matter of changing the color codes and the logo file and then zip it. You can download the SQL Server Report Server default package. You will these 3 files under the folder
Once you applied custom branding you can’t change the name as you want in the Site setting, so make sure you include the name in the logo as well.  To get a better appearance, based on my experience, it should scale to around 100px height and any length. However, some sites say It should scale to around 290px x 60px
If you need a more explanation about the color coding please refer to the below link.
Image 1
Image 2
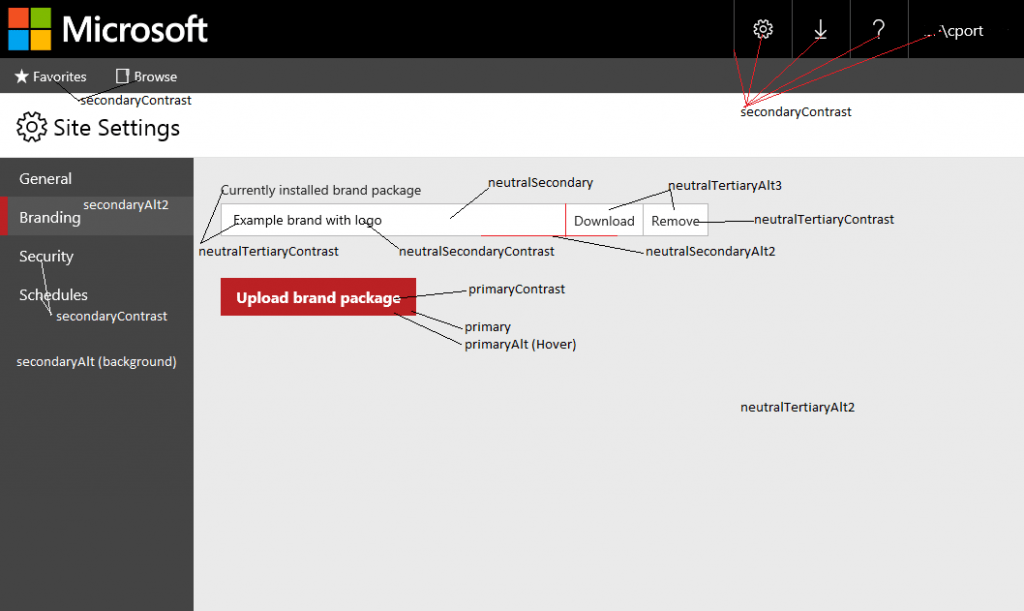
You can easily upload the new branding package using Site setting 🡪 Branding. There is no harm in this process, you can Download or Remove the package. Removing the package will reset the web portal to the default brand immediately.
 
Cheers!
Uma

Sunday, February 3, 2019

How to change date format in the PowerBI slicer

By default PowerBI Slicer for Date is displaying in mm/dd/yyyy. This slicer date format is based on the browser computer setting. Let’s say you want to change the format to something like dd/mm/yyyy
There are 2 places you might need to change in your computer, first one is regional setting in control panel as shown below.
The above setting mostly solve the problem, but some browsers might still show the old format. In this case, change your browser settings. Here is an example of how to change in everyone's favorite Google Chrome.
Cheers!
Uma

Wednesday, May 10, 2017

How to setup a Real-Time data analyze using Azure Stream Analytics and PowerBI

These days’ demand is high for Real-Time data analytics and can easily implement the system using cloud technologies. Real-time analytics is the use of, or the capacity to use, data and related resources as soon as the data enters the system.
Few well-known applications of real-time analytics:
  • Real-time credit card fraud detection  
  • CRM real-time analytics can provide up-to-the-minute information about an enterprise's customers and present it so that better and quicker business decisions.
  • Traffic detection
  • Wind speed
In this post, using a real-time feed from Twitter and Azure Cloud technologies.
You can find Azure Event Hub and Azure Stream Analytics under Internet Of Things marketplace category.
Step1: Create an Azure Event Hubs
Azure Event Hubs is a highly scalable publish-subscribe service that can invest millions of events per second and stream them into multiple applications. This lets you process and analyses the massive amounts of data produced by your connected devices and applications.
Use Event Hubs to:
  • Log millions of events per second in near real time.
  • Connect devices using flexible authorization and throttling.
  • Use time-based event buffering.
  • Get a managed service with elastic scale.
  • Reach a broad set of platforms using native client libraries.
  • Pluggable adapters for other cloud services.
Step2: Create Azure Stream Analytics
Azure Stream Analytics is a fully managed, cost-effective real-time event processing engine that helps to unlock deep insights from data. Stream Analytics makes it easy to set up real-time analytic computations on data streaming from devices, sensors, websites, social media, applications, infrastructure systems, and more.
With a few clicks in the Azure portal, you can author a Stream Analytics job specifying the input source of the streaming data, the output sink for the results of your job, and a data transformation expressed in a SQL-like language. You can monitor and adjust the scale/speed of your job in the Azure portal to scale from a few kilobytes to a gigabyte or more of events processed per second.
Stream Analytics leverages years of Microsoft Research work in developing highly tuned streaming engines for time-sensitive processing, as well as language integrations for intuitive specifications of such.
In this case Power BI used as stored data.

Used query:
SELECT Topic,count(*) AS Count, Avg(SentimentScore) AS AvgSentiment, System.Timestamp AS Insert_Time
FROM [tweets-input] TIMESTAMP BY CreatedAt
GROUP BY TumblingWindow(second,5), Topic
Step3: Feed real-time data to Event Hub
In this case, Twitter WPF Client used as real-time data feeder. To use this, you should create a twitter app and access token key for that.
You can create apps https://apps.twitter.com
Step4: Crete a Dashboard using real-time data
Once you start your Azure Stream Analytics, you will find data source will be available in Powerbi.com

Cheers!
Uma

Monday, April 10, 2017

How to use Grouping and Binning in Power BI

You can group your data into chunks for visualization purposes. Group is used for character fields and binning is used for numeric values.
Group
You can group data points to help you more clearly view, analyze, and explore data and trends in your visuals. The following example shows that how to group some cities into a group.

Binning
You can set the bin size for numerical and time fields in Power BI Desktop. You can use binning to right-size the data that Power BI Desktop displays. Binning is very useful in many purposes for example group into a range of data.

The following example shows that how to categorised into Payment due date.
In the same way, you can create a date data type fields with Bin Type as shown below.
Cheers! Uma

Saturday, January 28, 2017

How to use SUMMARIZECOLUMNS Function (DAX) in Power BI and SSAS Tabular

SUMMARIZECOLUMNS function returns a summary table over a set of groups. This new function is included in SQL Server 2016 Analysis Services (SSAS), Power Pivot in Excel 2016, and Power BI Desktop. SUMMARIZECOLUMNS, which is a replacement of SUMMARIZE and does not require the use of ADDCOLUMNS to obtain good performance
Power BI
SUMMARIZECOLUMNS function is very useful in Power BI report, especially to produce summarize/group/aggregate tables.
For example, if you need to create a summary table for sales value by subcategory, a year with some filters.
Summary Product Subcategory = SUMMARIZECOLUMNS
(
'Product Category'[Category],
'Product Subcategory'[Subcategory],
'Date'[Calendar Year],
FILTER('Product Category','Product Category'[Category]="Audio"),
"Total Sales",'Sales'[Sales Amount]
)
SSAS Tabular
You can use the function in SSAS cubes in similar ways, but you need to be aware how to use the syntaxes.
The following examples will give a clear idea about how to use SUMMARIZECOLUMNS function.


EVALUATE
SUMMARIZECOLUMNS
(
'Date'[Calendar Year],
"Total Sales",'Internet Sales'[Internet Total Sales]
)
EVALUATE
SUMMARIZECOLUMNS
(
'Product Category'[Product Category Name],
'Date'[Calendar Year],
"Total Sales",'Internet Sales'[Internet Total Sales]
)
EVALUATE
SUMMARIZECOLUMNS
(
'Product Category'[Product Category Name],
'Date'[Calendar Year],
FILTER('Date','Date'[Calendar Year]=2014),
"Total Sales",'Internet Sales'[Internet Total Sales],
"Total Units",'Internet Sales'[Internet Total Units]
)
EVALUATE
SUMMARIZECOLUMNS
(
'Product Category'[Product Category Name],
'Date'[Calendar Year],
FILTER('Date','Date'[Calendar Year]=2014),
"Total Sales",'Internet Sales'[Internet Total Sales],
"Total Sales with Correction",'Internet Sales'[Internet Total Sales]*0.99,
"Total Units",'Internet Sales'[Internet Total Units]
)


EVALUATE
SUMMARIZECOLUMNS
(
'Product Subcategory'[Product Subcategory Name],
'Date'[Calendar Year],
FILTER('Product Category','Product Category'[Product Category Name]="Bikes"),
"Total Sales",'Internet Sales'[Internet Total Sales],
"Total Units",'Internet Sales'[Internet Total Units]
)
Cheers! Uma