SUMMARIZECOLUMNS function returns a summary table over a set of groups. This new function is included in SQL Server 2016 Analysis Services (SSAS), Power Pivot in Excel 2016, and Power BI Desktop. SUMMARIZECOLUMNS, which is a replacement of SUMMARIZE and does not require the use of ADDCOLUMNS to obtain good performance

Power BI
SUMMARIZECOLUMNS function is very useful in Power BI report, especially to produce summarize/group/aggregate tables.
For example, if you need to create a summary table for sales value by subcategory, a year with some filters.
Summary Product Subcategory = SUMMARIZECOLUMNS
(
'Product Category'[Category],
'Product Subcategory'[Subcategory],
'Date'[Calendar Year],
FILTER('Product Category','Product Category'[Category]="Audio"),
"Total Sales",'Sales'[Sales Amount]
)

SSAS Tabular
You can use the function in SSAS cubes in similar ways, but you need to be aware how to use the syntaxes.
The following examples will give a clear idea about how to use SUMMARIZECOLUMNS function.
EVALUATE
SUMMARIZECOLUMNS
(
'Date'[Calendar Year],
"Total Sales",'Internet Sales'[Internet Total Sales]
)

EVALUATE
SUMMARIZECOLUMNS
(
'Product Category'[Product Category Name],
'Date'[Calendar Year],
"Total Sales",'Internet Sales'[Internet Total Sales]
)

EVALUATE
SUMMARIZECOLUMNS
(
'Product Category'[Product Category Name],
'Date'[Calendar Year],
FILTER('Date','Date'[Calendar Year]=2014),
"Total Sales",'Internet Sales'[Internet Total Sales],
"Total Units",'Internet Sales'[Internet Total Units]
)

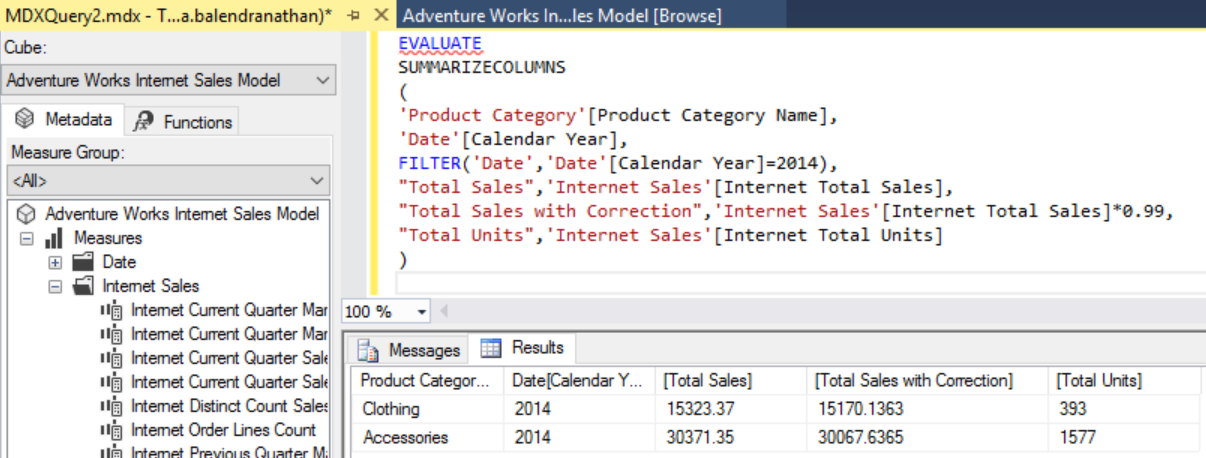
EVALUATE
SUMMARIZECOLUMNS
(
'Product Category'[Product Category Name],
'Date'[Calendar Year],
FILTER('Date','Date'[Calendar Year]=2014),
"Total Sales",'Internet Sales'[Internet Total Sales],
"Total Sales with Correction",'Internet Sales'[Internet Total Sales]*0.99,
"Total Units",'Internet Sales'[Internet Total Units]
)
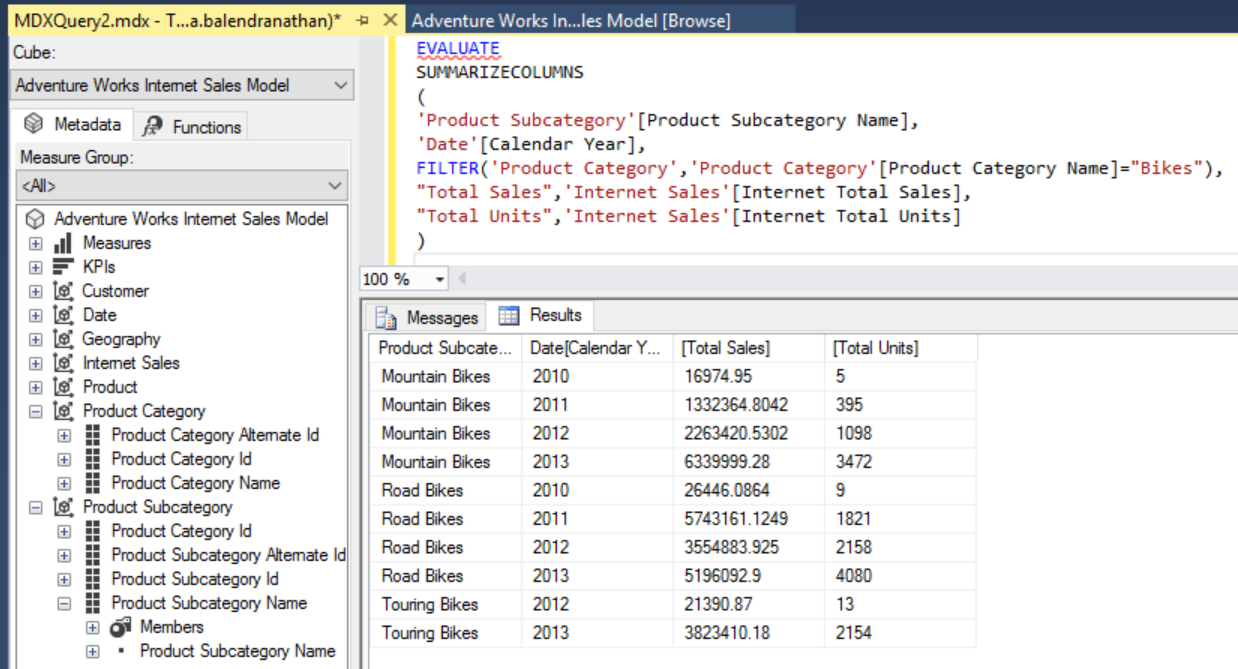
EVALUATE
SUMMARIZECOLUMNS
(
'Product Subcategory'[Product Subcategory Name],
'Date'[Calendar Year],
FILTER('Product Category','Product Category'[Product Category Name]="Bikes"),
"Total Sales",'Internet Sales'[Internet Total Sales],
"Total Units",'Internet Sales'[Internet Total Units]
)
Cheers!
Uma
Wonderful blog,Thanks for all the information you have provided. Business Analyst Online Training
ReplyDeletenice.Power BI Online Training
ReplyDeleteHi,
ReplyDeleteYou can have such summarizations by simply putting the necessary fields in Power BI visual if you have proper relationships defined, can't you? What is then practical use of SUMMARIZECOLUMNS?
This comment has been removed by the author.
ReplyDeleteIt's so nice article thank you for sharing a valuable content. Power BI Online Training Bangalore
ReplyDeleteVery nice article,Thank you...
ReplyDeletePower BI Course
I feel Power BI is the most useful and resource full tool that can easily take up more and more complex database operations and solutions and possibly recommend a simpler version of this.
ReplyDeletePowerbi Read Rest
link slot gacor terpercaya
ReplyDeletelink slot gacor
link slot
main slot
online slot