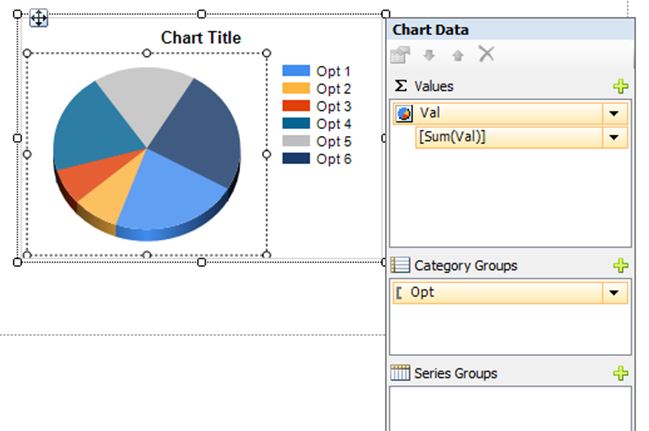
In SSRS List we cannot insert multi-value item like Graph inside the details: If we try to drag and drop the list it will through the error message as below:
This is because, in this List only has Details (row by row), so Graphs can’t show the value, but Gauge can use because it use only one value for indication. For this, we have add the group inside the details as below:
The data-set that I used here is:
To show the graph in the meaningful way (Opt Vs Val) I need to add the 2 groups that are SectionName and Question, inside the “Details”.
Once we add the group then we can insert the Graph inside the List:
Also can be insert the TextBoxes to display the Group details as below:
The final report will be display as below:
Cheers!
This has helped me to code a report on similar requirement. Thank you very much.
ReplyDelete