Tuesday, February 4, 2020

What is the different between Push and Stream dataset in Power BI

It’s important to understand the types of real-time datasets that are designed to display in tiles and dashboards, and how those datasets differ.

There are three types of real-time data sets

  • Push dataset

  • Stream dataset

  • PubNub dataset

Push dataset

With a push data set, data is pushed into Power BI service. When the dataset is created, the Power BI service automatically creates a new database in the service to store the data. Since there is an underlying database that continues to store the data as it comes in, reports can be created with the data. These reports and their visuals are just like any other report visuals, which means you can use all of Power BI’s report building features to create visuals, including Power BI visuals, data alerts, pinned dashboard tiles, and more.

On that dashboard, visuals update in real-time whenever the data is updated. Within the service, the database is triggering a tile refresh every time new data is received.

Streaming dataset

With a stream dataset, data is also pushed into the Power BI service, with an important difference: Power BI only stores the data into a temporary cache, which quickly expires. The temporary case is only used to display visuals, which have some transient sense of history, such a line chart has a time window of one hour.

With a stream dataset, there is no underlying database, so you cannot build report visuals using the data that flows in from the stream. As such, you cannot make use of report functionality such as filtering, Power BI visuals, and other report functions.

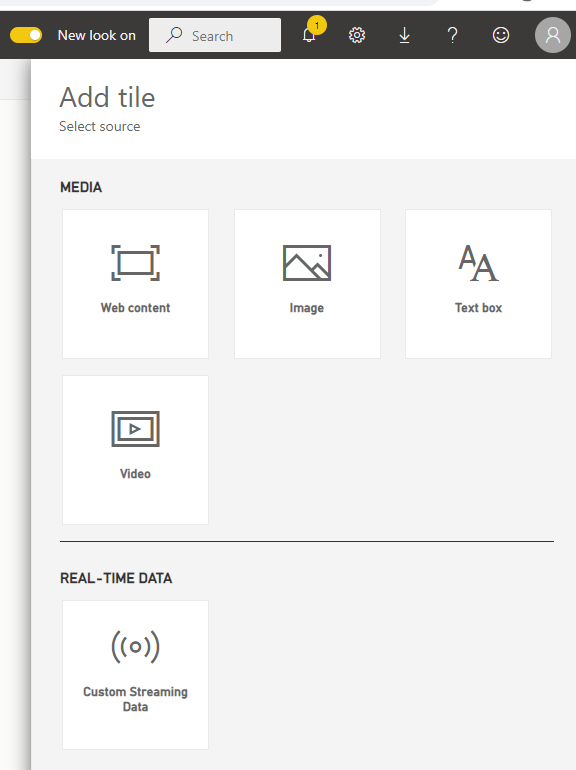
The only way to visualize a streaming dataset is to add a tile and use the streaming dataset as a custom streaming data source. The custom streaming tiles that are based on a streaming dataset are optimized for quickly real-time data.  There is little latency between when the data is pushed into the Power BI service and when the visual is updated, since there’s no need for the data to be entered into read from a database.

In practice, streaming datasets and their accompanying streaming visuals are best used in situations when it is critical to minimize the latency between when data is pushed and when it is visualized. In addition, it’s best practice to have the data pushed in a format that can be visualized as-is, without any additional aggregation. Examples of data that’s ready as-is include temperature, and pre-calculated averages.

PubNub streaming dataset

PubNub is a Realtime Communication Platform and realtime infrastructure-as-a-service (IaaS) company based in San Francisco, California. With a PubNub streaming dataset, the Power BI web client uses the PubNub SDK to read existing PubNeb data streams. 

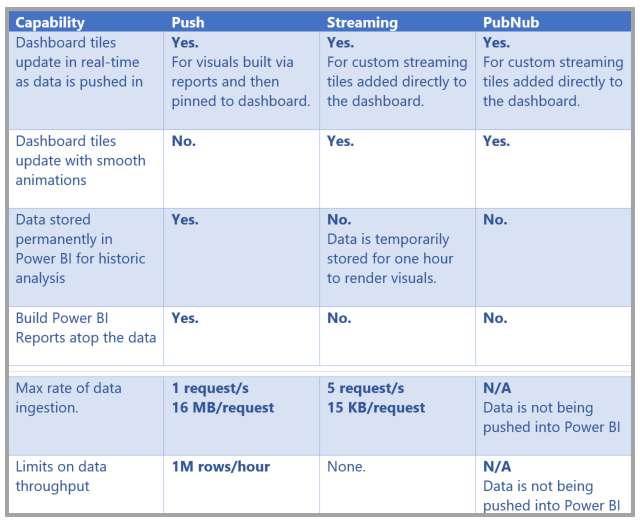
Streaming dataset matrix
Pushing data to datasets

There are three primary ways you can push data into a dataset:

  • Using the Power BI REST APIs

  • Using the Streaming Dataset UI

  • Using Azure Stream Analytics


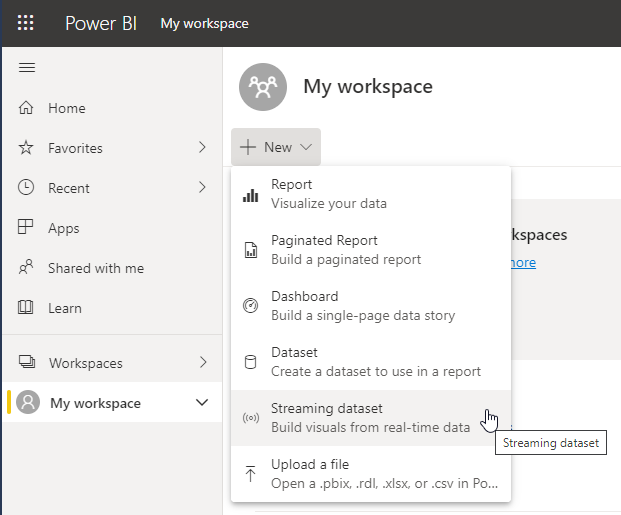
Choose API and define a dataset and define data value from stream. Historical data analysis can be enabled and disabled.
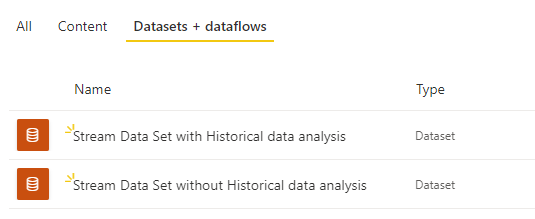
With Historical you can see Create report option is available, and the other one not

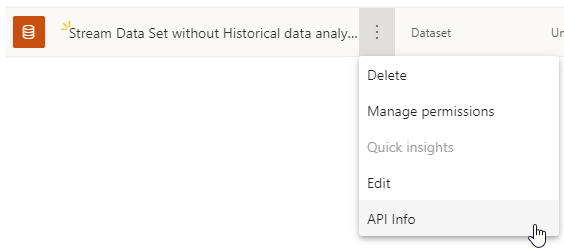
As I said previously Stream Data with Historical, allow you to create a report same as other source data.


Created a dashboard and add a tile
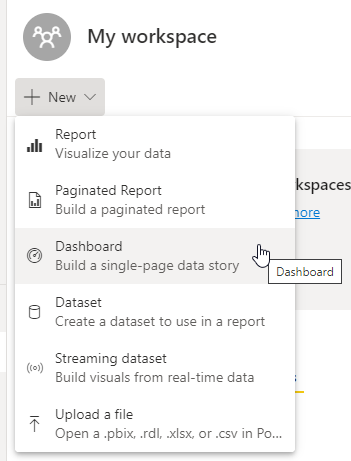
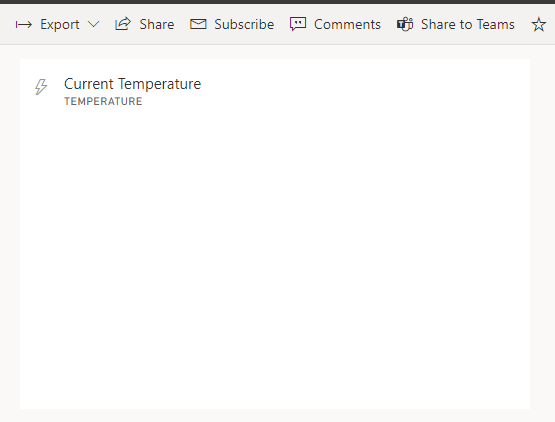
The add an existing Stream data source and choose visualization type 

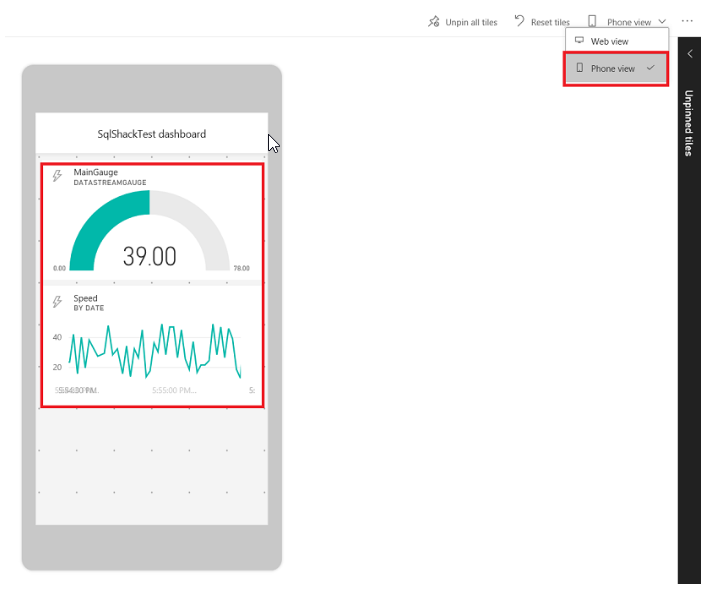
Phone view
Further read:

https://docs.microsoft.com/en-us/power-bi/connect-data/service-real-time-streaming

Cheers
Uma

Saturday, January 25, 2020

How to brand PowerBI Report Server

One of the coolest features of SQL Server Report Server is branding/customizing the report server web portal.  This feature was introduced in SQL Server 2016. We can do the same branding in PowerBI Report Server as well. In terms of the process there are no changes between SSRS and PowerBI report server branding.
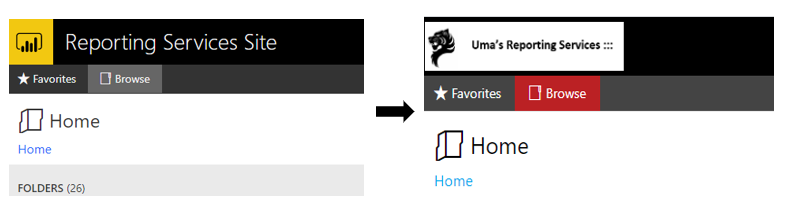
Before and after branding
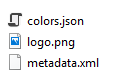
Let’s see the steps needed to follow. A brand package for reporting services consists of three files in a zip file.
  • Metadata.xml - The metadata.xml file allows you to set the name of the brand package, and has a reference entry for both your colors.json and logo.png files
  • Color.json - When the brand package is uploaded, the server extracts the appropriate name/value pairs from the colors.json file and merges them with the master LESS stylesheet, brand.less. This LESS file is then processed, and the resulting CSS file is served to the client. All colors in the stylesheet follow the six-character hexadecimal representation of a color
  • Logo.png – This is just an logo image. The logo file should be in png format

If you already have standard branding files, your job would be much easier, just a matter of changing the color codes and the logo file and then zip it. You can download the SQL Server Report Server default package. You will these 3 files under the folder
Once you applied custom branding you can’t change the name as you want in the Site setting, so make sure you include the name in the logo as well.  To get a better appearance, based on my experience, it should scale to around 100px height and any length. However, some sites say It should scale to around 290px x 60px
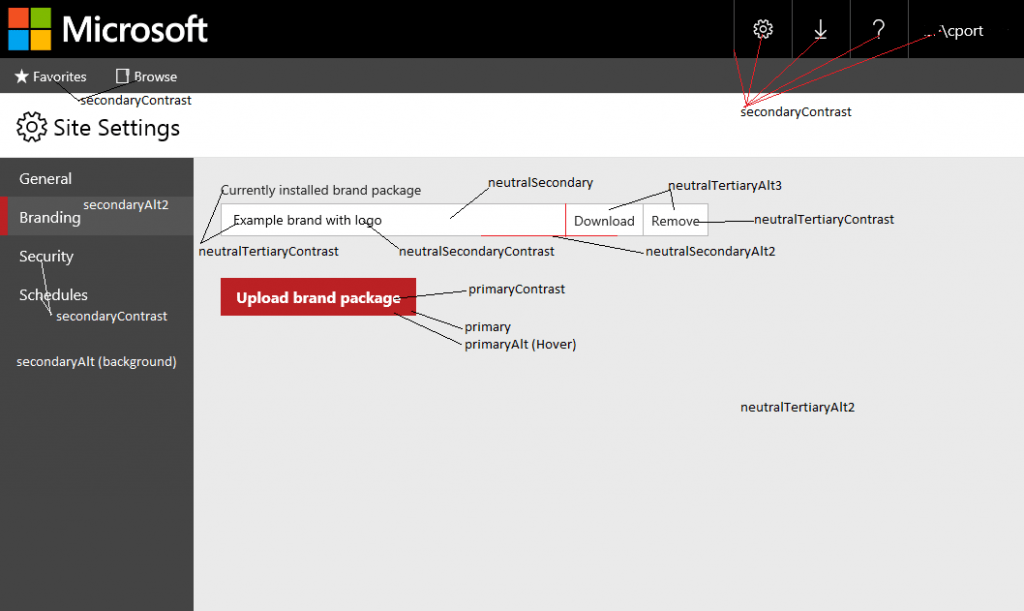
If you need a more explanation about the color coding please refer to the below link.
Image 1
Image 2
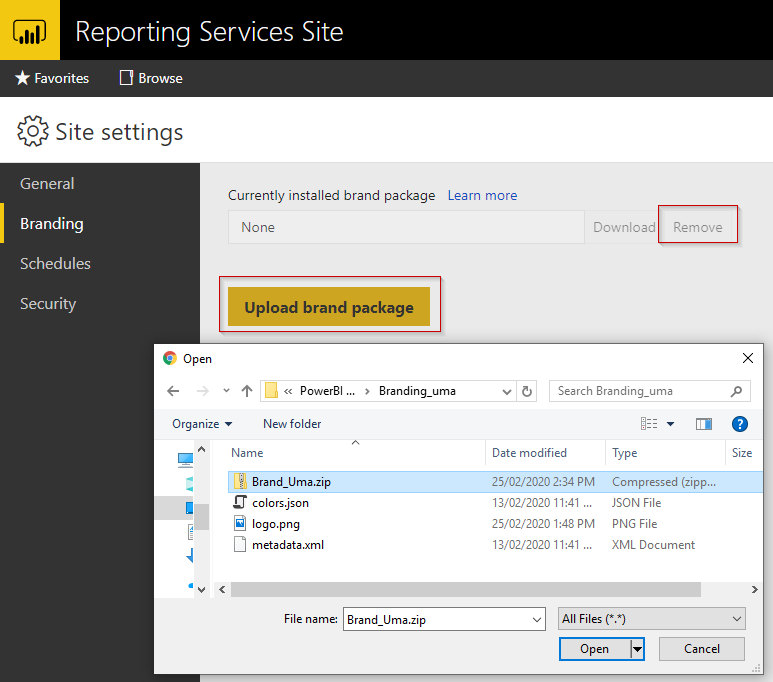
You can easily upload the new branding package using Site setting 🡪 Branding. There is no harm in this process, you can Download or Remove the package. Removing the package will reset the web portal to the default brand immediately.
 
Cheers!
Uma
Wednesday, December 11, 2019

Power BI Connection Types and Data refresh

I wanted to take a quick moment to outline the different connection types and data refresh. To understand how Power BI refreshes your datasets, reports and dashboards, you must aware of the following concepts:
Storage modes and dataset type
  • Power BI refresh types
  • Power BI Report Server
  • Storage modes and dataset type

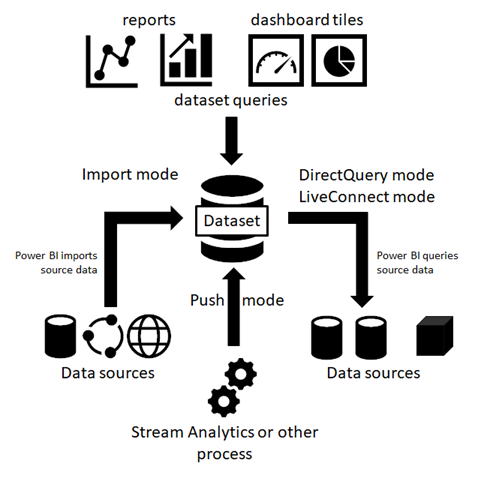
A Power BI dataset can operate in one of the following modes to access data from variety data sources
  • Import mode
  • DirectQuery mode
  • LiveConnect mode
  • Push mode

Datasets in Import mode
Power BI imports the data from the original data sources into the dataset.
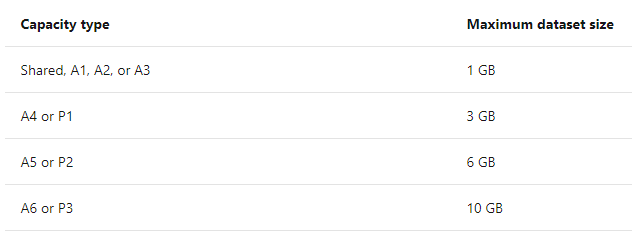
Because Power BI caches the data, Import mode dataset sizes can be substantial. Refer to the following table for maximum dataset sizes per capacity. Stay well below the maximum dataset sizes to avoid refresh issues that might occur if your datasets require more than the maximum available resources during a refresh operation.
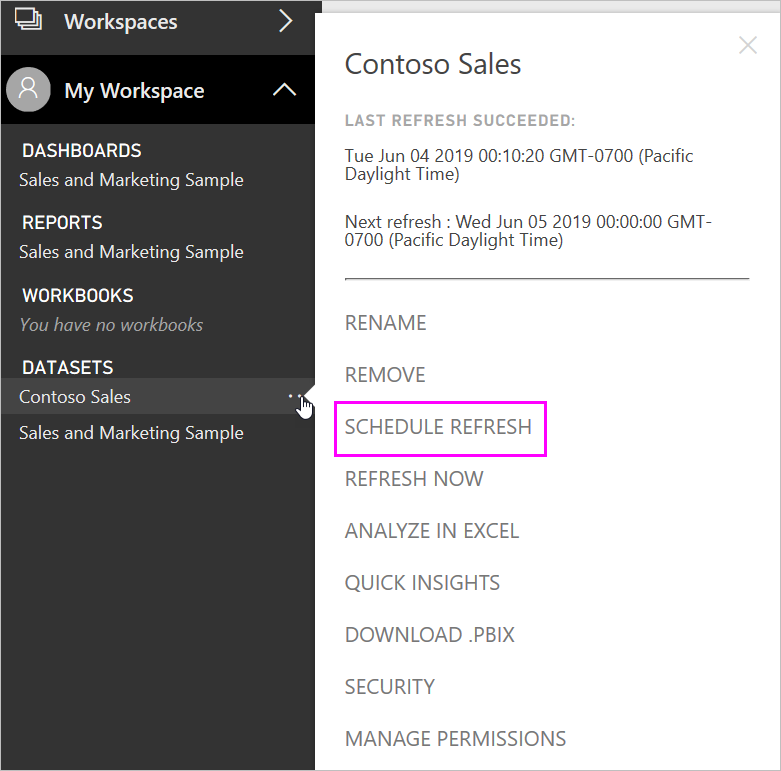
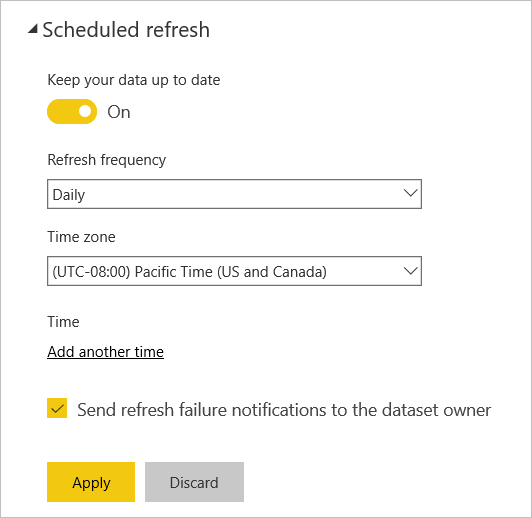
Schedule Refresh Scheduled refresh dialog box
Datasets in DirectQuery/LiveConnect mode
Power BI does not import data over connections that operate in DirectQuery/LiveConnect mode. Instead, the dataset returns results from the underlying data source whenever a report or dashboard queries the dataset.
Although DirectQuery mode and LiveConnect mode are similar in that Power BI forwards the queries to the source, it is important to note that Power BI does not have to transform queries in LiveConnect mode. The queries go directly to the Analysis Services instance hosting the database without consuming resources on shared capacity or a Premium capacity.
Live Connection refers to connecting directly to a Model (SSAS Multidimensional or Tabular) in this regard, all your modelling work is done on those. With Direct Query - you are connecting to a database, and you can create calculated columns and measures in Power BI. So, Power BI serves as your model layer, while keeping your data in your databases.
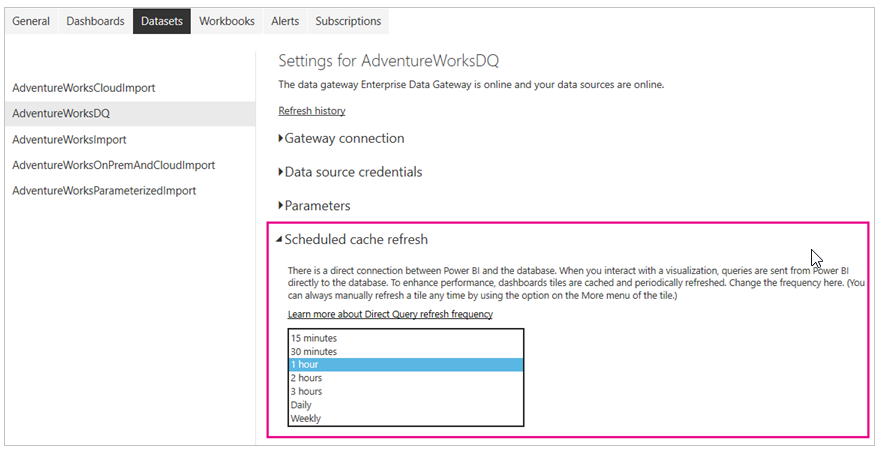
The Scheduled cache refresh section of the Datasets tab is not available for datasets in import mode. These datasets don't require a separate tile refresh because Power BI refreshes the tiles automatically during each scheduled or on-demand data refresh.
Push datasets
Push datasets don't contain a formal definition of a data source, so they don't require you to perform a data refresh in Power BI. You refresh them by pushing your data into the dataset through an external service or process, such as Azure Stream Analytics. This is a common approach for real-time analytics with Power BI. Power BI still performs cache refreshes for any tiles used on top of a push dataset.
Power BI refresh types
A Power BI refresh operation can consist of multiple refresh types, including data refresh, OneDrive refresh, refresh of query caches, tile refresh, and refresh of report visuals.

Data refresh

For Power BI users, refreshing data typically means importing data from the original data sources into a dataset, either based on a refresh schedule or on-demand. Power BI limits datasets on shared capacity to 8 daily refreshes. If the dataset resides on a Premium capacity, you can schedule up to 48 refreshes per day in the dataset settings. It is also important to call out that the shared-capacity limitation for daily refreshes applies to both scheduled refreshes and API refreshes combined. Also note that datasets on a Premium capacity don't impose limitations for API refreshes.
Data refreshes must complete in less than 2 hours on shared capacity. If your datasets require longer refresh operations, consider moving the dataset onto a Premium capacity. On Premium, the maximum refresh duration is 5 hours.

OneDrive refresh

If you created your datasets and reports based on a Power BI Desktop file, Excel workbook, or comma separated value (.csv) file on OneDrive or SharePoint Online, Power BI performs another type of refresh, known as OneDrive refresh. 
Unlike a dataset refresh during which Power BI imports data from a data source into a dataset, OneDrive refresh synchronizes datasets and reports with their source files. By default, Power BI checks about every hour if a dataset connected to a file on OneDrive or SharePoint Online requires synchronization.

Refresh of query caches

If your dataset resides on a Premium capacity, you might be able to improve the performance of any associated reports and dashboards by enabling query caching, as in the following screenshot. Query caching instructs the Premium capacity to use its local caching service to maintain query results, avoiding having the underlying data source compute those results.

Tile refresh

Power BI maintains a cache for every tile visual on your dashboards and proactively updates the tile caches when data changes. In other words, tile refresh happens automatically following a data refresh.
By default, Power BI maintains a single cache for every tile, but if you use dynamic security to restrict data access based on user roles, as covered in the article row-level security (RLS) with Power BI, then Power BI must maintain a cache for every role and every tile. The number of tile caches multiplies by the number of roles.

Refresh of report visuals

This refresh process is less important because it is only relevant for live connections to Analysis Services. 

How to configure Power BI report scheduled refresh


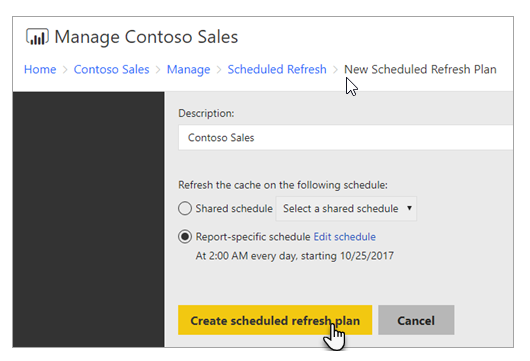
To refresh data in your Power BI report, a scheduled refresh plan must be created. This is done within the Manage area of a Power BI report. This schedule is same as SSRS Report Schedule.
Cheers!
Uma

Monday, October 14, 2019

How to load SNOMED data into MS SQL Database

You can find many collections of scripts on the web, here I used from West Coast Informatics.

http://www.westcoastinformatics.com/resources.html

There is no any script for MSSQL Server, but available for MySQL, Postgres and Oracle. In this approach create a MySQL database and convert it to MSSQL database. Otherwise you need rewrite the script your own including Java code.

As a prerequisite Java and MySQL installation is required.

You can download MySQL from https://dev.mysql.com/downloads/installer/

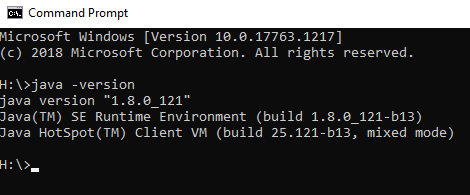
For Java, first make sure Java is already installed or not. If java is correctly installed, you will get something like this.

If not installed, you can download from https://java.com/en/download/win10.jsp

Load into a MySQL database

Create a schema called snomed in MySQL database

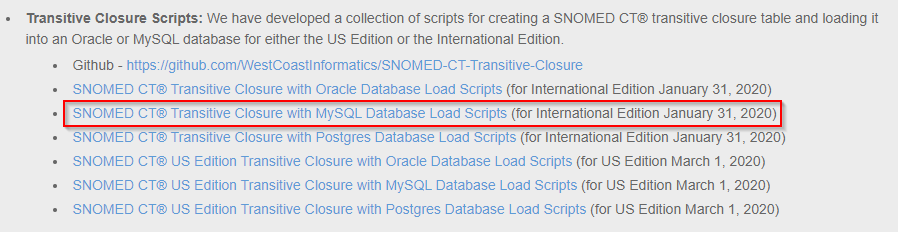
Download SNOMED CT® MySQL Database Load Scripts (for International Edition January 31, 2020) from West Coast Informatics site or from other sources.

In this case loading International Edition, download above highlighted once.

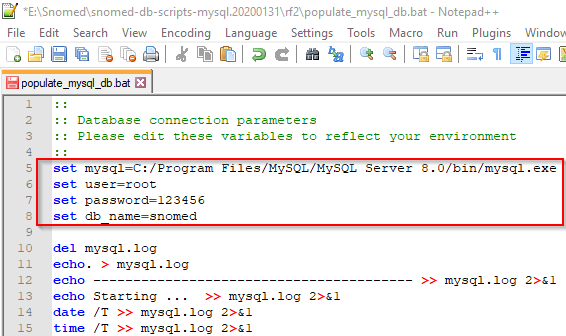
Change the database connection parameters in the batch file populate_mysql_db.bat


Get Snomed latest data

Download Snomed latest data from https://www.health.govt.nz/nz-health-statistics/classification-and-terminology/new-zealand-snomed-ct-national-release-centre/snomed-ct-software-tools or from other sources.

In this case, SnomedCT_InternationalRF2_PRODUCTION_20200309T120000Z.zip is used. Once you unzip and copy all the above 6 data script related files into this folder. You will see something like this. 

Change the source file names as per the source data in mysql_tables.sql file mostly the date part are different. In this case, I changed 20200131 to 20200309.

 'Snapshot/Terminology/sct2_Concept_Snapshot_INT_20200131.txt' to 'Snapshot/Terminology/sct2_Concept_Snapshot_INT_ 20200309.txt'

Run populate_mysql_db.bat file, this will take quite a bit of time to complete. This bat file will generate all the tables with data and views.

Load Transitive Closure

A file containing the transitive closure of the SNOMED CT subtype hierarchy. The transitive closure file is not currently distributed but can be generated from the snapshot relationship file using a script file.

Download Transitive Closure Scripts from for MySQL  http://www.westcoastinformatics.com/resources.html

Once you unzip it you will see something like this

Copy all the above files to the previous folder.

Generate transitive closure file from the snapshot relationship file, the code is written in Java.

Change the input and output file parameter in transitive_closure.bat and run

At the end you will see transitive closure file is generated

Next you need to load data from this file to MySQL database, for that edit the parameters in populate_mysql_db_tc.bat

Also change the Transitive Closure file path in mysql_tc_table.sql 

Change the parameters in populate_mysql_db_tc.bat and run

Once the batch file is completed, you will see the new Transitive Closure table with relevant views. This process will take quite a bit of time.

Migrate MySQL database to MSSQL

create a new database called Snomed in MSSQL server


Download SSMA for MySQL and follow the steps as per this

https://datamigration.microsoft.com/scenario/mysql-to-sqlserver?step=1&tabnav=true

Create a new project in SSMA and connect to the Snomed database in MySQL and MSSQL server


Create the conversion report that will generate an HTML report with conversion statistics and error/warnings. This report will help to understand conversion issues and its cause.

In this case, I didn’t get any issues for schema conversion, if you find any errors you need to change the local schema and regenerate the report to check everything ok. 

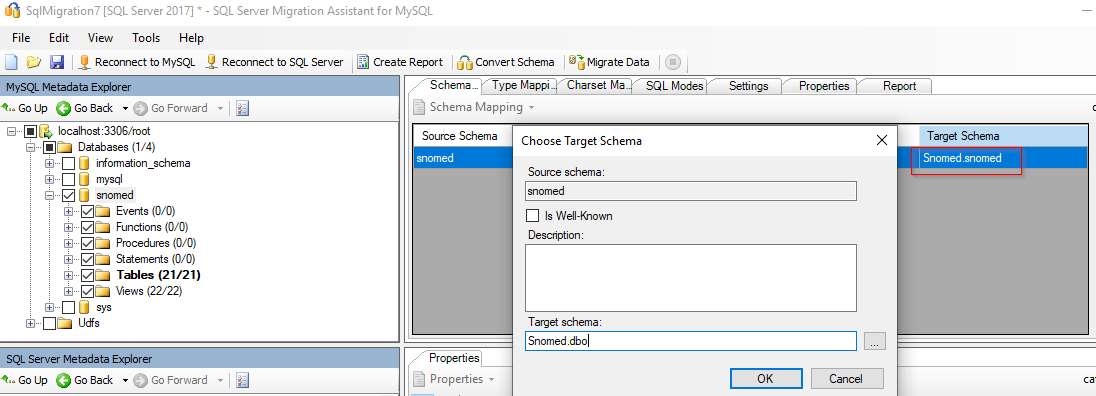
Only change here is target schema to dbo instead of snomed. In MySQL Snomed database click on tables then Snomed database schema details come in the right side as shown below.


To publish the schema, select the database from MSSQL Server database “Database” node in the “SQL Server Metadata Explorer” and choose “Synchronize with Database” from right-click menu options. This action will publish the MySQL schema to the SQL Server instance.

Then migrate the data

The migrated data report will pop up at the end and data will be ready in MSSQL database.


Cheers!
Uma