Thursday, April 17, 2014

Cache Connection Manager SSIS 2012 with Example


This post is about Cache Connection Manager and Cache Transform. The cache connection manager reads data from cache transformation or from a cache files (.caw) and can save the data to a cache file. Using the Cache Connection Manager (CCM) is a new option for the Lookup transform in SSIS 2008. The CCM provides an alternative to doing lookups against a database table using an OLEDB connection. Whether you configure the cache connection manager to use a cache file, the data is always stored in memory. The cache connection manager does not support the Binary large Object (BLOB) data type DT_TEXT, DT_NTEXT and DT_IMAGE.

The following images shows that how to create New Cache Connection.

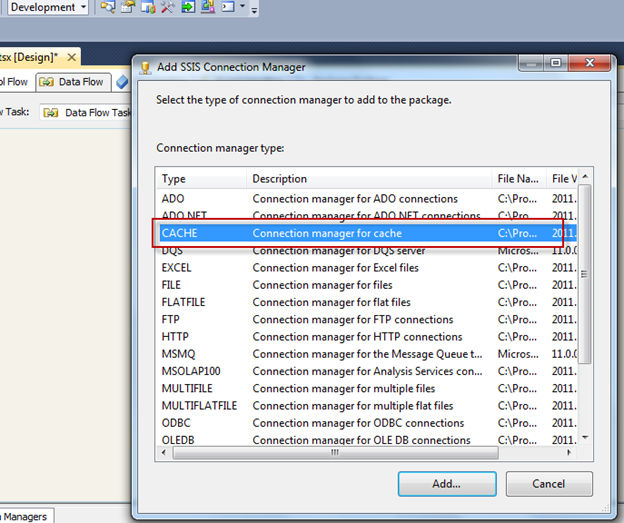
Cache connection can be made by file or in memory.
Option 1: Create cache directly in memory.

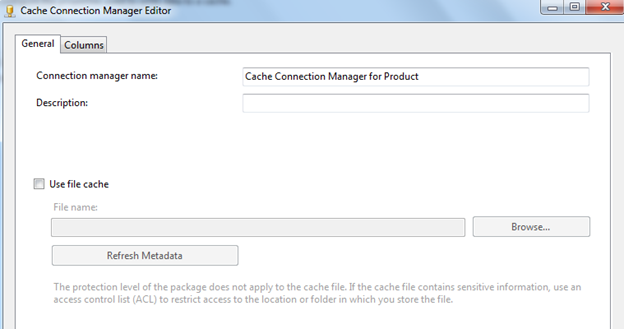
Option 2: Create cache use file cache.

Here I am going to demonstrate without use file cache. As I am going to use Product Number as mapping column so that make the index for Product Number as 1, and leave others as default.

The Index Position column if set to something greater than 0 simply denotes an index, let’s say a key or Primary Key if you wish. But this mapped column should be indexed, otherwise you will get error message as below:
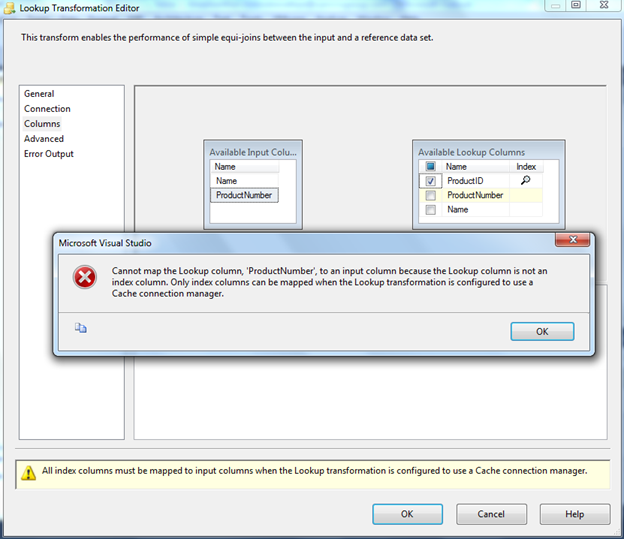
Error message: Cannot map the Lookup column, 'ProductNumber', to an input column because the Lookup column is not an index column. Only index columns can be mapped when the Lookup transformation is configured to use a Cache connection manager.

You can use any source format such as csv, excel and etc.


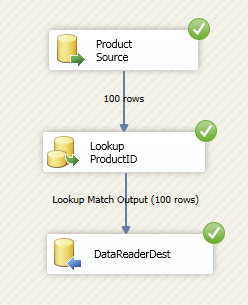
The following images show that how to do the Case Transformation using Cache Transform component. Here I am using OleDBConnection to get the data from table.


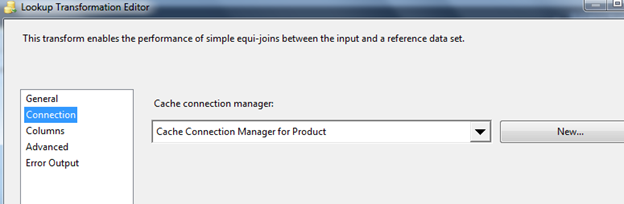
Now let see how to use this case transformation under lookup.


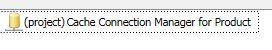
If you want you can use same cache under any package under this project, you need to make it as Cache as Project Connection Manager.
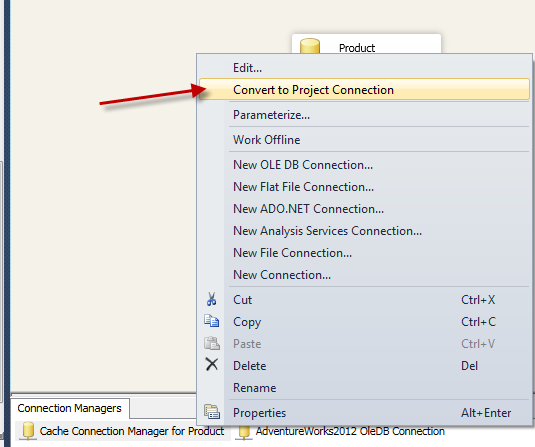
Cheers!

Tuesday, April 15, 2014

Read data from XML file and Load to Tree control C# Code

This post is showing, how to read the data form XML file and load to Tree Control in ASP.NET using C#.
I created a XML file as below:

Create ASP.NET empty web application and under the form just drag and drop the Tree Control which is under navigation tag.

The sample code shows below.
using System;
using System.Collections.Generic;
using System.Linq;
using System.Web;
using System.Web.UI;
using System.Web.UI.WebControls;
using System.Xml;

namespace XMLDemo
{
    public partial class WebForm1 : System.Web.UI.Page
    {
        protected void Page_Load(object sender, EventArgs e)
        {

        }

        protected void Button1_Click(object sender, EventArgs e)
        {
            //Create a doc Document and load the XML data into it.
            XmlDocument doc = new XmlDocument();
            doc.Load("E://Testing.NET//StudentList.xml");
            XmlNodeList studentList = doc.SelectNodes("/");

            // SECTION 2. Initialize the TreeView control.
            TreeView1.Nodes.Clear();
            TreeView1.Nodes.Add(new TreeNode(doc.DocumentElement.Name));
            TreeNode tNode = new TreeNode();
            tNode = TreeView1.Nodes[0];

            // SECTION 3. Populate the TreeView with the DOM nodes.
            AddNode(doc.DocumentElement, tNode);
            TreeView1.ExpandAll();

        }

        private void AddNode(XmlNode inXmlNode, TreeNode inTreeNode)
        {
            XmlNode xNode;
            TreeNode tNode;
            XmlNodeList nodeList;
            int i;

            // Loop through the XML nodes until the leaf is reached.
            // Add the nodes to the TreeView during the looping process.
            if (inXmlNode.HasChildNodes)
            {
                nodeList = inXmlNode.ChildNodes;
                for (i = 0; i <= nodeList.Count - 1; i++)
                {
                    xNode = inXmlNode.ChildNodes[i];

                    inTreeNode.ChildNodes.Add(new TreeNode(xNode.Name));
                    tNode = inTreeNode.ChildNodes[i];
                    AddNode(xNode, tNode);
                }
            }
            else
            {
                // Here you need to pull the data from the XmlNode based on the
                // type of node, whether attribute values are required, and so forth.
                inTreeNode.Text = (inXmlNode.OuterXml).Trim();
            }
        }
    }
}

The output will be like as below.

Writing XMLA Query to retrieve or manipulate data from Microsoft SQL Server Analysis Services


Microsoft SQL Server Analysis Services uses the XML for Analysis (XMLA) protocol to handle all communication between client applications and an Analysis Services instance. At their most basic level, other client libraries such as ADOMD.NET and AMO construct requests and decode responses in XMLA, serving as an intermediary to an Analysis Services instance, which uses XMLA exclusively.

To support the discovery and manipulation of data in both multidimensional and tabular formats, the XMLA specification defines two generally accessible methods, Discover and Execute, and a collection of XML elements and data types.

Because XML allows for a loosely coupled client and server architecture, both methods handle incoming and outgoing information in XML format. Analysis Services is compliant with the XMLA 1.1. specification, but also extends it to include data definition and manipulation capability, implemented as annotations on the Discover and Execute methods.

As a programmer, you can use XMLA as a programmatic interface if solution requirements specify standard protocols, such as XML, SOAP, and HTTP. Programmers and administrators can also use XMLA on an ad hoc basis to retrieve information from the server or run commands.

Discover Method (XMLA)

Retrieves information, such as the list of available databases or details about a specific object, from an instance of Microsoft SQL Server Analysis Services. The data retrieved with the Discover method depends on the values of the parameters passed to it.Namespace   urn:schemas-microsoft-com:xml-analysis
SOAP Action   "urn:schemas-microsoft-com:xml-analysis:Discover"

Now let see how to get the databases from Analysis Services is fairly easy with a simple XMLA query like the following:


<Discover xmlns="urn:schemas-microsoft-com:xml-analysis">
                <RequestType>DBSCHEMA_CATALOGS</RequestType>
                <Restrictions />
                <Properties />

</Discover>

Once you run, you will get the output and save it as XML file, you will see the output will be look like below.


You would think that getting a list of cubes would involve another fairly simple XMLA query like the following:
<Discover xmlns="urn:schemas-microsoft-com:xml-analysis">
                <RequestType>MDSCHEMA_CUBES</RequestType>
                <Restrictions />
                <Properties />
</Discover>

 In these query no any conditions apply under RESTRICTION, it retrieves the entire cube under all the databases.
Let see how to specify the particular database and retrieve only the cubes under the database.
<Discover xmlns="urn:schemas-microsoft-com:xml-analysis">
                <RequestType>MDSCHEMA_CUBES</RequestType>
                <Restrictions />
                <Properties>
                                <PropertyList>
                                                <Catalog>UmaTEST</Catalog>
                                </PropertyList>
                </Properties>
</Discover>

Execute Method (XMLA)

Sends XML for Analysis (XMLA) commands to an instance of Microsoft SQL Server Analysis Services. This includes requests involving data transfer, such as retrieving or updating data on the server.

Namespace   urn:schemas-microsoft-com:xml-analysis
SOAP Action   "urn:schemas-microsoft-com:xml-analysis:Execute"

The following code sample is an example of Execute method call that contains a Multidimensional Expression (MDX) SELECT statement.
<Execute xmlns="urn:schemas-microsoft-com:xml-analysis">
                <Command>
                                <Statement>
                                                SELECT [Measures].MEMBERS ON COLUMNS FROM [Adventure Works DW2012]
                                </Statement>
                </Command>
                <Properties>
                                <PropertyList>
                                                <Catalog>UmaTEST</Catalog>
                                                <Format>Multidimensional</Format>
                                                <AxisFormat>ClusterFormat</AxisFormat>
                                </PropertyList>
                </Properties>
</Execute>

Cheers!


Error: 0xC0209303 at Package, Connection manager "Excel Connection Manager": The requested OLE DB provider Microsoft.ACE.OLEDB.12.0 is not registered. If the 64-bit driver is not installed, run the package in 32-bit mode.

The error might occur when you run the package  in the 64 bit environment, but when you test your connection, it says success.

Details error message : Error: 0xC0209303 at Package, Connection manager "Excel Connection Manager": The requested OLE DB provider Microsoft.ACE.OLEDB.12.0 is not registered. If the 64-bit driver is not installed, run the package in 32-bit mode. Error code: 0x00000000.

The Reason is package is trying to run via 64 bit driver while running the package, so the solution is to make Run64BitRunTime = False.


Create and Populate Date Dimension

There are many Create and Populate Date Dimension post already available. However, here I have simplified the table structure and the populate data via stored procedure. Also This will answer how to extend the date range in AdventureWorksDW2012.
Table structure:
CREATE TABLE dbo.DimDate(
 [DateKey] [int] IDENTITY(1,1) NOT NULL,
 [FullDate] [datetime] NOT NULL,
 [DayNumberOfWeek] [tinyint] NOT NULL,
 [EnglishDayNameOfWeek] [varchar](20) NOT NULL,
 [DayNumberOfMonth] [tinyint] NOT NULL,
 [DayNumberOfYear] [smallint] NOT NULL,
 [WeekNumberOfYear] [tinyint] NOT NULL,
 [CalendarEnglishMonthName] [varchar](20) NOT NULL,
 [CalendarEnglishShortMonthName] [char](3) NULL,
 [CalendarMonthNumberOfYear] [smallint] NOT NULL,
 [CalendarQuarter] [tinyint] NOT NULL,
 [CalendarYear] [int] NOT NULL,
 [CalendarSemester] [tinyint] NOT NULL,
 [FiscalYear] [smallint] NULL,
 [FiscalSemester] [smallint] NULL,
 [FiscalQuarter] [smallint] NULL,
 CONSTRAINT [PK_DimDate] PRIMARY KEY CLUSTERED
 (
   [DateKey] ASC
 )
);

Stored Procedure to extend or populate the date dimension table records.
CREATE PROCEDURE insertDate
 @StartDate  DATETIME = NULL,
 @EndDate  DATETIME =NULL
AS
BEGIN 
SET IDENTITY_INSERT dbo.DimDate ON

WHILE @StartDate <= @EndDate
BEGIN
INSERT INTO dbo.DimDate
(  DateKey
 ,FullDate
 ,DayNumberOfWeek
 ,EnglishDayNameOfWeek
 ,DayNumberOfMonth
 ,DayNumberOfYear
 ,WeekNumberOfYear
 ,CalendarEnglishMonthName
 ,CalendarEnglishShortMonthName
 ,CalendarMonthNumberOfYear
 ,CalendarQuarter
 ,CalendarYear
 ,CalendarSemester
 ,FiscalYear
 ,FiscalSemester
 ,FiscalQuarter
)

SELECT  
CONVERT(INTEGER, CONVERT(CHAR(10),  @StartDate, 112)) AS DateKey

, @StartDate AS FullDate

, DATEPART(dw, @StartDate) AS DayNumberOfWeek

, DATENAME(dw, @StartDate) AS EnglishDayNameOfWeek

, DAY (@StartDate) AS DayNumberOfMonth

, DATENAME(dayofyear, @StartDate) AS DayNumberOfYear

, DATENAME(week, @StartDate) AS WeekNumberOfYear

, DATENAME(mm, @StartDate) AS CalendarEnglishMonthName

, LEFT(DATENAME(mm, @StartDate),3) AS CalendarEnglishShortMonthName

, MONTH(@StartDate) AS CalendarMonthNumberOfYear

, DATENAME(quarter, @StartDate) AS CalendarQuarter

, YEAR(@StartDate) AS CalendarYear

, CASE
 WHEN DATENAME(quarter, @StartDate) <= 2 THEN 1 
 ELSE 2
  END AS CalendarSemester

, CASE
 WHEN DATEPART(m, @StartDate) >= 7 THEN YEAR(@StartDate) + 1 ELSE YEAR(@StartDate)
 END AS FiscalYear

, CASE
 WHEN DATENAME(quarter, @StartDate) >= 3 THEN 1 ELSE 2
 END AS FiscalSemester

, CASE
 WHEN MONTH(@StartDate) IN (7, 8, 9) THEN 1
 WHEN MONTH(@StartDate) IN (10, 11, 12) THEN 2
 WHEN MONTH(@StartDate) IN (1, 2, 3) THEN 3
 WHEN MONTH(@StartDate) IN (4, 5, 6) THEN 4
    END AS FiscalQuarter

SET @StartDate = DATEADD(dd, 1, @StartDate)
END
SET IDENTITY_INSERT dbo.DimDate OFF
END

To insert or extend the records, just run the SP with Start Date and End Date.


Cheers!

Data Profiling Task with Example – SSIS 2012

This post is about Data Profiling Task in SSIS 2012 and demonstrates how to use this task. The Data Profiling task computes various profiles that help you become familiar with a data source and identity problems in the data that have to be fixed. Mostly, Data Profiling task inside Integration Service package to profile data that is stored in SQL Server and to identify potential problems with data quality.
First drag and drop the Data Profiling Task into the Control Flow.


Next, double click on this task and configure the destination file, output comes as XML format. Optionally, if you want make it File Overwrite as True and if file does not exist then create it every time.


You can make use Quick profile wizard to configure the request profiles.


Once you click on it, it will prompt the below screen, there connect to the source server and select target Table or View and then select the compute options as you per your requirement. Once you have done this profile request will be as below, here you can do the changes individually such as change the table or select the column.
The following five profiles analyze individual columns.
Profiles that analyze individual columns
Description
Column Length Distribution Profile
Reports all the distinct lengths of string values in the selected column and the percentage of rows in the table that each length represents.
This profile helps you identify problems in your data, such as values that are not valid. For example, you profile a column of United States state codes that should be two characters and discover values longer than two characters.
Column Null Ratio Profile
Reports the percentage of null values in the selected column.
This profile helps you identify problems in your data, such as an unexpectedly high ratio of null values in a column. For example, you profile a Zip Code/Postal Code column and discover an unacceptably high percentage of missing codes.
Column Pattern Profile
Reports a set of regular expressions that cover the specified percentage of values in a string column.
This profile helps you identify problems in your data, such as string that are not valid. This profile can also suggest regular expressions that can be used in the future to validate new values. For example, a pattern profile of a United States Zip Code column might produce the regular expressions: \d{5}-\d{4}, \d{5}, and \d{9}. If you see other regular expressions, your data likely contains values that are not valid or in an incorrect format.
Column Statistics Profile
Reports statistics, such as minimum, maximum, average, and standard deviation for numeric columns, and minimum and maximum fordatetime columns.
This profile helps you identify problems in your data, such as dates that are not valid. For example, you profile a column of historical dates and discover a maximum date that is in the future.
Column Value Distribution Profile
Reports all the distinct values in the selected column and the percentage of rows in the table that each value represents. Can also report values that represent more than a specified percentage of rows in the table.
This profile helps you identify problems in your data, such as an incorrect number of distinct values in a column. For example, you profile a column that is supposed to contain states in the United States and discover more than 50 distinct values.
The following three profiles analyze multiple columns or relationships between columns and tables.
Profiles that analyze multiple columns
Description
Candidate Key Profile
Reports whether a column or set of columns is a key, or an approximate key, for the selected table.
This profile also helps you identify problems in your data, such as duplicate values in a potential key column.
Functional Dependency Profile
Reports the extent to which the values in one column (the dependent column) depend on the values in another column or set of columns (the determinant column).
This profile also helps you identify problems in your data, such as values that are not valid. For example, you profile the dependency between a column that contains United States Zip Codes and a column that contains states in the United States. The same Zip Code should always have the same state, but the profile discovers violations of this dependency.
Value Inclusion Profile
Computes the overlap in the values between two columns or sets of columns. This profile can determine whether a column or set of columns is appropriate to serve as a foreign key between the selected tables.
This profile also helps you identify problems in your data, such as values that are not valid. For example, you profile the ProductID column of a Sales table and discover that the column contains values that are not found in the ProductID column of the Products table.


Run the Package, and locate to the file location, you will the xml file will be created. Alternatively you can open the profile task and click on Open Profile Viewer; this is the interface to view the profile in appropriate way.


Here you will be able to see all the relevant details.


Requirements and Limitations:


The Data Profiling task works only with data that is stored in SQL Server. This task does not work with third-party or file-based data sources.


Furthermore, to run a package that contains the Data Profiling task, you must use an account that has read/write permissions, including CREATE TABLE permissions, on the tempdb database.
(More details: http://technet.microsoft.com/en-us/library/bb895263.aspx)